


InfoWARE AI Analyst Daily Market Report: 07-Nov-2025 | InfoWARE Finance
Get IDIA - the stock trading app for the modern investor


InfoWARE AI Analyst Daily Market Report: 07-Nov-2025
(Source: InfoWARE Terminal, Date: 07-Nov-2025)
Dear Investor,
Market Wrap: Friday, 7 November 2025
It was a risk-off session on the Nigerian Exchange (NGX) today, with the All Share Index (ASI) sliding -0.33% to 150,026.55, moderating the impressive YTD return to 44.92%. Turnover fell -7.26% from the previous session as total traded value clocked ₦13.81 billion, and daily market breadth remained negative, with just 25 advancers versus 41 decliners. Unusual volumes in several banking and insurance names flagged heightened institutional interest and rotation, while NEWGOLD and NCR stole the show in the top gainers and losers tables respectively. The Naira maintained a firm tone, appreciating 0.02% to 1,442 against the Dollar.
-
Market Breadth:
- Market breadth at 0.61x (25 advancers vs. 41 decliners) underscores strong selling pressure and ongoing profit booking after the YTD rally.
- Overall liquidity softened: both trading volume -15.4% and value -7.26% declined, reflecting some risk aversion or "wait-and-see" positioning.
-
Top Gainers & Losers:
Stock Price % Change RSI Notable Signal NEWGOLD 57,449.00 +11.55% 43.7 Bullish momentum, crossed above 15DMA NCR 19.35 +9.94% 84.8 Overbought RSI, may be due for correction MCNICHOLS 3.02 +9.8% 35.5 Low RSI, possible early upturn EUNISELL 70.90 +9.24% 80.3 Overbought zone, monitor for reversal DEAPCAP 1.73 +8.81% 44.0 Bullish crossover, high volatility BERGER 35.10 -10.00% 49.0 Below 15DMA, bearish momentum CILEASING 5.03 -9.86% 36.6 Bearish momentum, negative MACD MECURE 27.70 -9.77% 80.6 Potential exhaustion, overbought RSI CHAMPION 13.00 -9.72% 43.1 Bounce possible, RSI near oversold TIP 10.75 -9.66% 39.7 Bearish baseline, high volatility
Insights & Predictions
- Turnover drop: -7.26% contraction in market turnover is a mild red flag—suggests participants are taking risk off the table, or rotating into cash ahead of year-end positioning. Such dips often precede volatility bursts or sector reallocations.
- Advancers vs. Decliners: Consistent negative breadth (0.61x) can foreshadow further drawdowns unless a fresh catalyst emerges.
-
Unusual Volume Standouts:
- WEMABANK: Traded 90.9M shares vs 9.5M 90-day average (+855% volume!) but price -2.08% — likely large institutional unloading after rally; follow-up signals needed before calling a floor.
- MANSARD: Volume surge (>11x normal) on a -5.00% dip, pointing to unambiguous distribution/selling pressure.
- GUINNESS: Over 10x average volume, with price up +3.94% — suggests accumulation; watch for follow-through upside.
-
Top Gainers: Momentum Watch
- NCR & EUNISELL rank among the week’s strongest stocks and also appear as daily top gainers, but both have RSI above 80 (overbought) — likely due for short-term pullbacks or volatility spikes.
- NEWGOLD features in both the daily and top 5D gainers, plus bullish 15DMA crossover—ETF flows may be hedging or safe-haven bets.
- CHAMPION & CILEASING are prominent in the top losers both YTD and for today; persistent selling pressure may portend further downside.
- Bullish Momentum (15DMA Cross): NEWGOLD, DEAPCAP, MAYBAKER, and two ETFs flashed bullish signals. Notably, NEWGOLD combines multiple bullish themes (price surge, >15DMA, ETF status) — worth monitoring for possible institutional accumulation.
- Bearish Momentum (15DMA Breaks): CUSTODIAN, MECURE (on both losers and bearish lists), and FCMB broke below 15DMA. Especially watch MECURE: price is sharply down, RSI is high (80.6), indicating blow-off top risk after a hype rally.
- Persistent YTD Losers: CHAMPION, CILEASING, and BERGER are in today’s losing cohort and among the worst YTD performers, underscoring a clear absence of bottom fishers—and suggesting sentiment is still negative or capital is flowing elsewhere.
Contrarian Signals
- CHAMPION (−9.8% YTD): RSI is neutral (43.1), MACD is negative (but less so than prior day), and the stock is near yearly lows, but PE is ultra-high (412x). Any positive catalyst could prompt a short-covering rally, but fundamental value is suspect.
- MECURE: RSI is extremely high (80.6, overbought), but price is falling sharply (-9.77%); suggests exhaustion — be cautious of whipsaw action.
- NCR: RSI hit 84.8 (overbought), but MACD still positive and strong price action; momentum followers beware of reversal traps.
- DEAPCAP: Bullish technicals (cross above 15DMA, strong % move), but fundamental PE is eye-wateringly high (188x), signaling price can swing hard either way.
Sector Heatmaps & Flows
| Sector | Sample Stocks | Best Performer | Worst Performer | Institutional vs Retail (%) | Trend |
|---|---|---|---|---|---|
| Banking | ZENITHBANK, WEMABANK | WEMABANK +854% Vol (but price -2.08%) | ACCESSCORP -2.22% | Inst: 73.48 / Retail: 26.52 | Rotational flows, profit-taking |
| Insurance | MANSARD, CONHALLPLC, ASOSAVINGS | CONHALLPLC +4.16% (Vol +300%) | MANSARD: -5.00% | Mixed; volume spikes | Distribution, hot money moving in/out |
| Consumer | EUNISELL, GUINNESS | EUNISELL +9.24% (Overbought RSI) | TIP: -9.66% | Balanced | Momentum chasing, watch reversal risk |
| ETF/Funds | NEWGOLD, GREENWETF | NEWGOLD +11.55% | VETINDETF (-7.33%, crossed below 15DMA) | High (safe haven flows?) | Bullish flows, risk-off hedging |
Dividend-Beta Matrix (Defensive Stock Cluster)
| Stock | Sector | Div. Yield (%) | Beta | Comment |
|---|---|---|---|---|
| CUSTODIAN | Diversified Industries | 1.20 | 0.540 | High yield + low beta; technical breakdown (-10.26%) |
| ASOSAVINGS | Mortgage | 10.00 | 0.00 | Ultra high yield, very illiquid, watch default/volatility risk |
| DEAPCAP | Other Fin. | 13.76 | 0.89 | Dividend plus bullish momentum; PE unsustainably high (188x) |
| ZENITHBANK | Banking | 2.25 | 1.20 | Defensive, but now at major institutional profit-taking |
| AFRIPRUD* | Other Fin. | 1.27 | 0.64 | Classic 'defensive'—worth watching in downturns |
Institutional Clustering Alerts
- ZENITHBANK: 73.5% of today's market volume was institutional, with 88.3% of trade value from institutions. This is a clustering flag—expect either a forthcoming consolidation or a sharp move on any new news (earnings, regulation).
- MTNN: More than 80% of trade value by institutional hands, though price was flat—a sign of equilibrium, but possible set-up for breakout if market direction sharpens.
- SEPLAT and ARADEL: Block trades; both had almost all trading value from institutional desks, highlighting sector-wide reallocation in energy/oil.
High Dividend + Momentum Outliers
- DEAPCAP: Dividend yield of 13.76% and bullish cross above 15DMA; however PE is 188.8x. This is classic for "yield traps"—traders, not income investors, dominate here; expect aggressive swings.
- CUSTODIAN: Attractive yield (1.20%) and very low beta, but now in technical breakdown (-10.26%); suggest standing aside until price finds support.
- ZENITHBANK: Defensive but not momentum-driven—recent institutional profit-taking could set the stage for better entries in weeks ahead.
Suggestions for Traders
- Momentum Names: Consider short-term protection or trailing stops on NCR and EUNISELL due to overbought RSIs. Watch NEWGOLD and DEAPCAP for follow-through if ETF flows continue.
- High Volume Outflows: WEMABANK and MANSARD's huge volumes on price declines may precede rebounds—but let confirmation show before bottom-fishing.
- Sector Watch: If ETFs (NEWGOLD, GREENWETF) sustain momentum, broader risk-off appetite could rise — allocate accordingly.
- Yield + Momentum: Be cautious of "too good to be true" high yielders with unsustainable PEs (e.g. DEAPCAP).
- Take note of stocks showing both institutional concentration and technical inflection (e.g. ZENITHBANK), as these areas often see outsized moves after periods of absorption.
YTD Top 5 Gainers & Losers
| # | Stock | Price | YTD % Chg | 5D % Chg | RSI | Momentum |
|---|---|---|---|---|---|---|
| 1 | HONYFLOUR | 21.90 | +216.5% | +21.7% | 50.8 | Sideways, momentum mild |
| 2 | NCR | 17.60 | +251.8% | +20.9% | 84.8 | Overbought |
| 3 | EUNISELL | 64.90 | +267.9% | +20.2% | 80.3 | Overbought, hot money in control |
| 4 | MERVALUE (ETF) | 216.70 | +20.9% | +10.0% | 56.8 | Moderate |
| 5 | STANBICETF30 | 550.00 | +15.2% | +9.6% | 54.5 | Stable ETF flows |
| 1 | SOVRENINS | 3.08 | -27.8% | -9.1% | 40.7 | Bearish grind |
| 2 | SKYAVN | 80.60 | -19.0% | 0.0% | 27.8 | Oversold territory, watch for bounce |
| 3 | CHAMPION | 14.40 | -18.5% | -9.7% | 43.1 | Grinding down, bear trend |
| 4 | CILEASING | 5.58 | -17.5% | -9.9% | 36.6 | Bear flag |
| 5 | INTENEGINS | 2.70 | -17.0% | -9.6% | 41.8 | Low momentum |
Market Activity Deep Dive: Institutional vs Retail
-
Institutions controlled the bulk of value and volume:
- 73.5% of all traded shares and 88.3% of value were institutional. Yet the number of trades (just 8% of total) confirms they’re usually block trades (large sizes, low frequency).
-
Top Institutional Trades:
- ZENITHBANK: 3.88% of institutional trades by volume, 7.97% by value
- MTNN, ACCESSCORP, SEPLAT, and ARADEL also showed high institutional trade concentration—indicative of sector rotations and/or portfolio rebalancing at scale.
-
Top Retail Flows:
- Retail heavily traded MTNN, ZENITHBANK, and ACCESSCORP—but in substantially smaller sizes than institutional flows.
-
Pattern Correlation:
- Stocks with both high institutional activity and near technical inflection points (e.g., ZENITHBANK, ACCESSCORP, MTNN) tend to precede outsized moves when retail traders eventually jump in, amplifying any established trend.
- Unusual volumes in names like WEMABANK and MANSARD signal institutional rotations; wait for confirmation before chasing these moves.
-
Actionable Standouts:
- Monitor names with converging signals: high volume, institutional involvement, and technical crossovers—e.g., NEWGOLD (bullish), CILEASING/CHAMPION (bearish), ZENITHBANK (potential trend change as block trades peak).
Bottom line: Expect ongoing choppiness, with ETF inflows acting as a volatility gauge for sentiment. Institutional clusters are shaping near-term direction—look for reversals in overbought gainers and deeper floor-testing in persistent losers.
|
Top ASI Gainers Over Last 5 Trading Days
|
Top ASI Losers Over Last 5 Trading Days
|
For more detailed analysis, on InfoWARE Market Data Terminal <NSEPERF> <GO>
On InfoWARE Finance Mobile App (Android, iPhone & iPad, Windows Phone and Windows 8/10), "Top Gainers & Losers"
NEWGOLD EXCHANGE TRADED FUND (ETF) (NEWGOLD) topped the advancers list closing at N57,449.00 with a gain of 11.55% followed by NCR (NIGERIA) PLC. (NCR) which closed at N19.35 with a gain of 9.94%.
On the flip side BERGER PAINTS PLC (BERGER) and C & I LEASING PLC. (CILEASING) topped the decliners log with a loss of -10.00% at a close of N35.10, and -9.86% to close the day at N5.03 respectively.
| Symbol | LClose | %Chg |
|---|---|---|
| NEWGOLD | 57,449.00 | 11.55 |
| NCR | 19.35 | 9.94 |
| MCNICHOLS | 3.02 | 9.82 |
| LOTUSHAL15 | 93.00 | 9.41 |
| EUNISELL | 70.90 | 9.24 |
For more detailed analysis,
- On InfoWARE Market Data Terminal <TOPG> <GO>
- On InfoWARE Finance Mobile App ( Android, iPhone & iPad and Windows 10) , "Top Gainers & Losers"
Currency Market
In the currency market, the Naira appreciated 0.02%(0.30) against the Dollar to settle at 1 to 1Investment Insights - Top 5 Gainers YTD
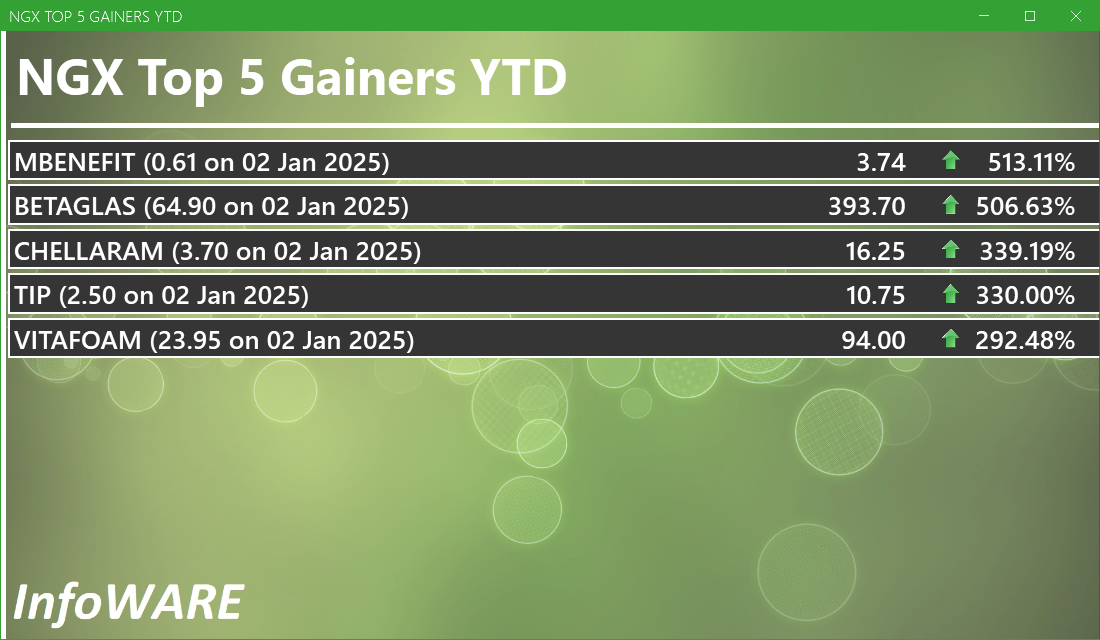
These stocks are the best performers whose price has risen faster than the market as a whole with the best returns year to date. Momentum investors believe that stocks that have outperformed the market will often continue to do so because the factors that caused them to outperform will not suddenly disappear. In addition, other investors seeking to benefit from the stock’s outperformance will often purchase the stock, further bidding its price higher and pushing the stock higher still
For more detailed analysis,
- On InfoWARE Market Data Terminal <T5YTD2> <GO>
- On InfoWARE Finance Mobile App ( Android , iPhone & iPad and Windows 10) , "Research"
NSE: Bull Signal - Price crossed above 15 Day MA
This signal implies these stocks are under buying pressure and the price might continue to rise and therefore positions should be monitored closely. Further suggested analysis include looking at the overall market (ASI) to see if the uptrend is market wide, sector wide or specific to the stock. Portfolio managers tend to use this as a signal to do more research to add to their positions or lock in some profits. Typically further analysis should be done using commands like PC and RV on the InfoWARE Market Data Terminal. Another command is ALERTS to set price triggers for possible exit or entry as necessary
For more detailed analysis,
- On InfoWARE Market Data Terminal <NSEPERF> <GO>
- On InfoWARE Finance Mobile App ( Android , iPhone & iPad and Windows 10) , "Top Gainers & Losers"
| Symbol | Price | %Chg | 15DMA | PE | EPS | DivY | MktCap | Vol | Trades | Value | LstTradeTime |
|---|---|---|---|---|---|---|---|---|---|---|---|
| NEWGOLD | 57,449.00 | 10.36 | 54,470.60 | 0.00 | 0.00 | 0.00 | 0.00 | 1.00 | 1.00 | 57.45K | 07-Nov-2025 14:30:35.497 |
| DEAPCAP | 1.73 | 8.09 | 1.72 | 188.84 | 0.01 | 13.76 | 2.60B | 1.48M | 48.00 | 2.43M | 07-Nov-2025 14:30:07.773 |
| MAYBAKER | 17.60 | 6.25 | 17.59 | 58.94 | 0.14 | 3.75 | 30.36B | 651.12K | 87.00 | 10.70M | 07-Nov-2025 14:30:10.103 |
| VETGRIF30 | 56.00 | 1.79 | 55.99 | 0.00 | 0.00 | 111.00 | 3.00 | 6.19K | 07-Nov-2025 14:30:35.550 | ||
| GREENWETF | 386.00 | 0.26 | 385.87 | 0.00 | 0.00 | 50.00 | 2.00 | 19.30K | 07-Nov-2025 14:30:35.473 |
NSE: BEAR Signal - Price crossed below 15 Day MA
This signal implies these stocks are under selling pressure and the price might continue to slide and therefore positions should be monitored closely. Further suggested analysis include looking at the overall market (ASI) to see if the downtrend is market wide, sector wide or specific to the stock. If the overal market trend is upwards, then since these stocks are heading in the opposite direction, then further analysis should be done using commands like PC and RV on the InfoWARE Market Data Terminal. Another command is ALERTS to set price triggers for possible exit is necessar
For more detailed analysis,
- On InfoWARE Market Data Terminal <BEARM> <GO>
- On InfoWARE Finance Mobile App ( Android , iPhone & iPad and Windows 10)
| Symbol | Price | %Chg | 15DMA | PE | EPS | DivY | MktCap | Vol | Trades | Value | LstTradeTime |
|---|---|---|---|---|---|---|---|---|---|---|---|
| JBERGER | 138.90 | -0.79 | 139.22 | 16.73 | 10.31 | 1.74 | 222.24B | 941.33K | 119.00 | 131.48M | 07-Nov-2025 14:30:10.003 |
| FCMB | 10.40 | -3.85 | 10.55 | 104.31 | 0.09 | 5.62 | 205.95B | 7.40M | 943.00 | 77.53M | 07-Nov-2025 14:30:07.910 |
| VETINDETF | 55.90 | -7.33 | 57.77 | 0.00 | 0.00 | 60.00 | 3.00 | 3.44K | 07-Nov-2025 14:30:35.560 | ||
| NGXGROWTH | 14,387.93 | -8.06 | 15,408.91 | 18.83 | 0.18 | 0.00 | 0.00 | 11.17M | 505.00 | 95.93M | 07-Nov-2025 14:30:16.090 |
| CUSTODIAN | 38.50 | -10.26 | 41.98 | 3.80 | 3.29 | 1.20 | 226.45B | 1.00M | 108.00 | 38.68M | 07-Nov-2025 14:30:07.683 |
| MECURE | 27.70 | -10.83 | 30.04 | 0.00 | 0.00 | 366.68K | 30.00 | 10.16M | 07-Nov-2025 14:30:38.783 | ||
| FGS202791 | 70.00 | -42.85 | 94.00 | 0.00 | 0.00 | 500.00 | 1.00 | 350.01K | 07-Nov-2025 14:30:15.447 |
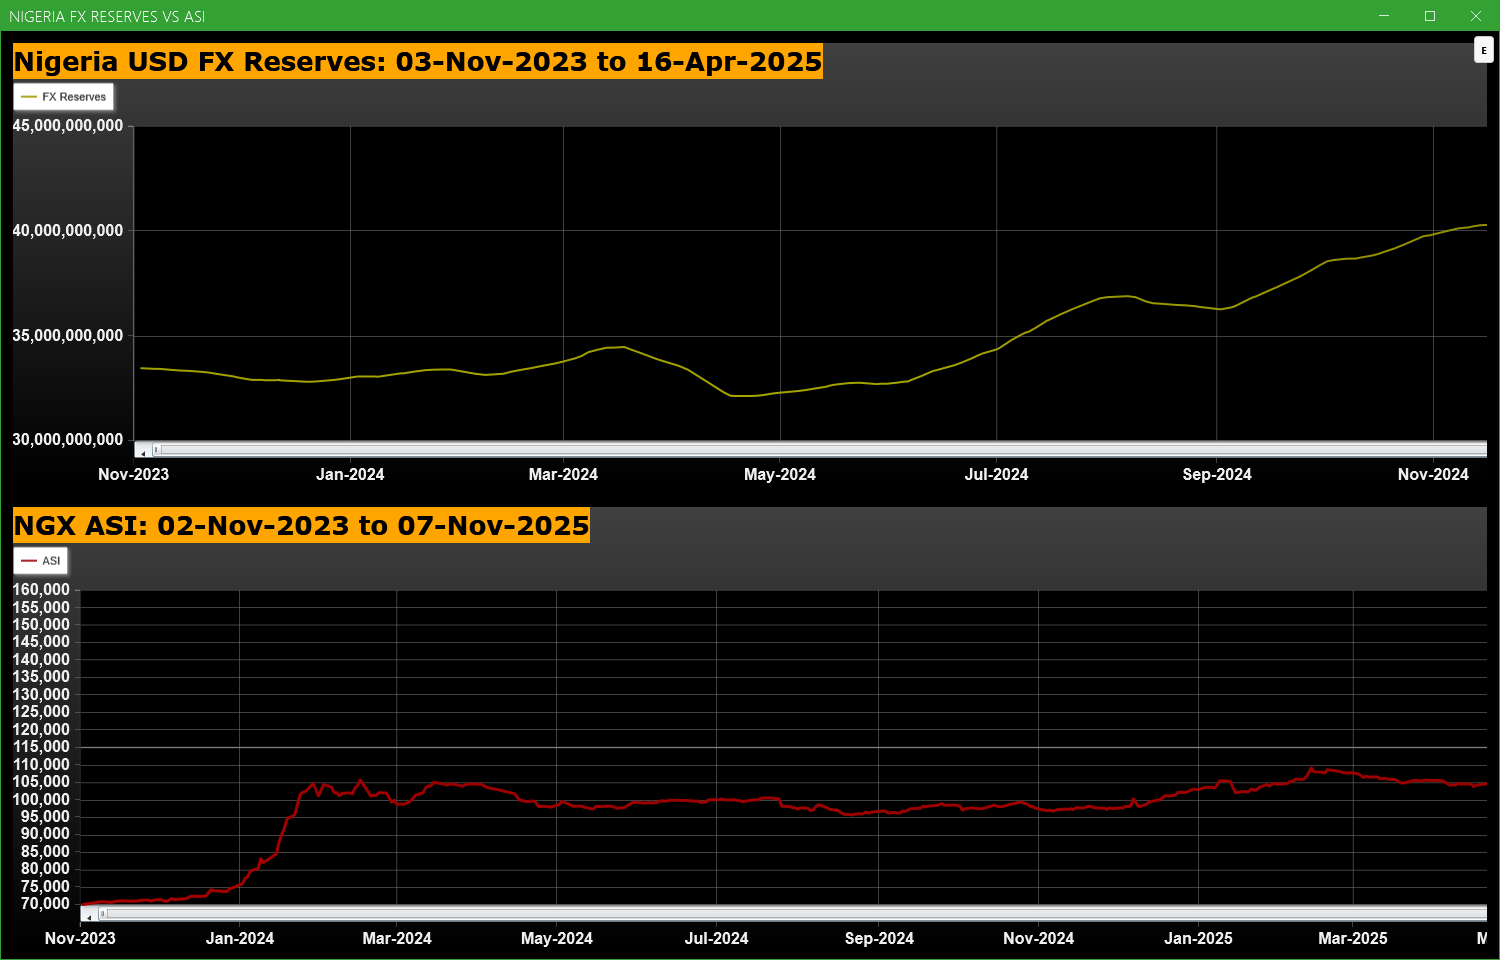
Economic Indicators - Nigeria FX Reserves Vs ASI Chart
Nigeria FX Reserves are assets held on reserve by CBN in foreign currencies. These reserves are used to back liabilities and influence monetary policy. Given the nature of the Nigeria economy, FX Reserves can appear to have an outsize influence on the economy and hence on the capital market. The chart below allows comparison of FX Reserves against the ASI to make investment decisions
For more detailed analysis,
- On InfoWARE Market Data Terminal <CI> <GO>
- On InfoWARE Finance Mobile App ( Android , iPhone & iPad and Windows 10) , "Research"
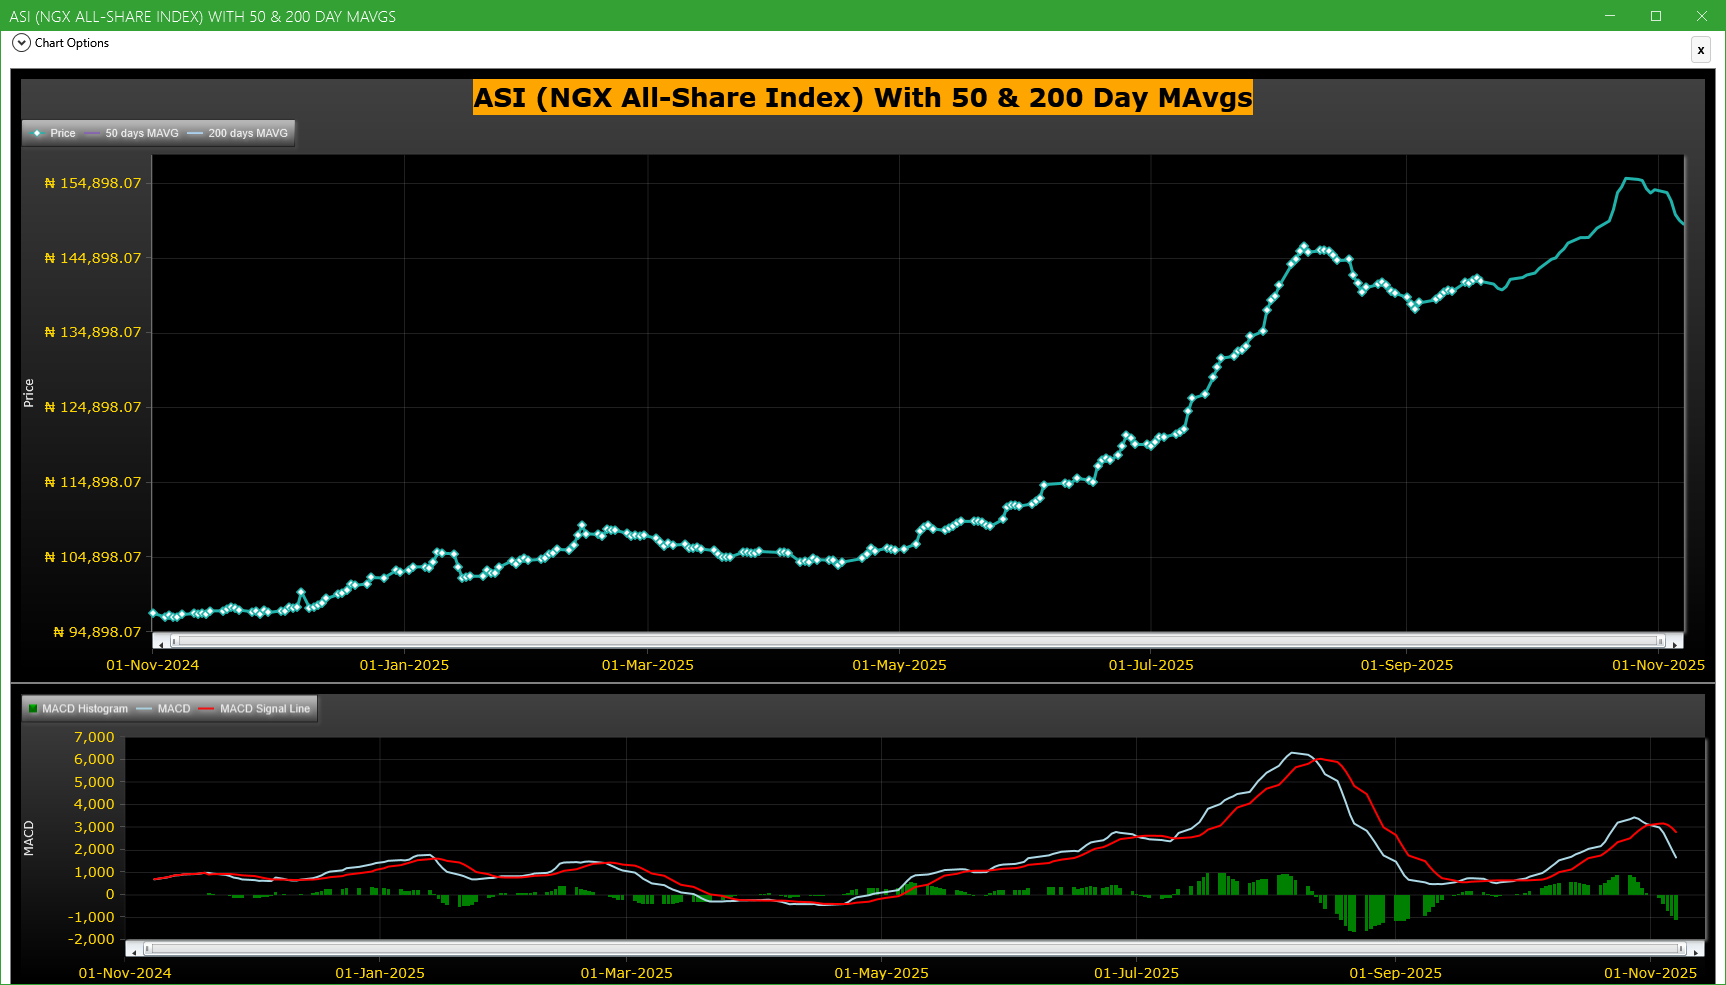
Market Trend - ASI (NGX All-Share-Index) With 50 & 200 Day MAvgs Chart
Technical traders typically use the 50 & 200 day moving averages to aid in choosing
where to enter or exit a position, which then causes these levels to act as strong
support or resistance. As a general guideline, if the price is above a moving average,
the trend is up. If the price is below a moving average, the trend is down.
It is important to note that critics of technical analysis say that moving averages act
as support and resistance because so many traders use these indicators to inform their
trading decisions. Also moving averages tend to work quite well in strong trending conditions
but poorly in choppy or ranging conditions.
Trading Strategies: Crossovers
Crossovers are one of the main moving average strategies. The first type is a price crossover,
which is when the price crosses above or below a moving average to signal a potential change
in trend. Another strategy is to apply two moving averages to a chart: one longer and one
shorter. When the shorter-term MA crosses above the longer-term MA, it is a buy signal, as
it indicates that the trend is shifting up. This is known as a golden cross. Meanwhile, when
the shorter-term MA crosses below the longer-term MA, it is a sell signal, as it indicates that
the trend is shifting down. This is known as a dead/death cross
For more detailed analysis,
- On InfoWARE Market Data Terminal <CI> <GO>
- On InfoWARE Finance Mobile App ( Android , iPhone & iPad and Windows 10) , "Research"
Unusual Volume: Volume traded is more than double the 90 day moving average (All exchanges; ASI & ASem). For more detailed analysis,
- On InfoWARE Market Data Terminal <UV> <GO>
- On InfoWARE Finance Mobile App ( Android , iPhone & iPad and Windows 10)
| Symbol | Name | Volume | 90DAvgVol | %VolChg | Price | LClose | %Chg | Trades | Value |
|---|---|---|---|---|---|---|---|---|---|
| WEMABANK | WEMA BANK PLC. | 90.88M | 9.52M | 854.67 | 18.85 | 19.25 | -2.08 | 377 | 1.71B |
| CONHALLPLC | CONSOLIDATED HALLMARK INSURANCE PLC | 78.34M | 19.60M | 299.69 | 4.26 | 4.09 | 4.16 | 80 | 317.30M |
| MANSARD | MANSARD INSURANCE PLC | 32.35M | 2.65M | 1,118.57 | 13.30 | 14.00 | -5.00 | 159 | 430.59M |
| ASOSAVINGS | ASO SAVINGS AND LOANS PLC | 16.16M | 6.24M | 158.96 | 0.90 | 0.94 | -4.26 | 230 | 13.83M |
| GUINNESS | GUINNESS NIG PLC | 9.71M | 880.41K | 1,002.55 | 176.70 | 170.00 | 3.94 | 173 | 1.69B |
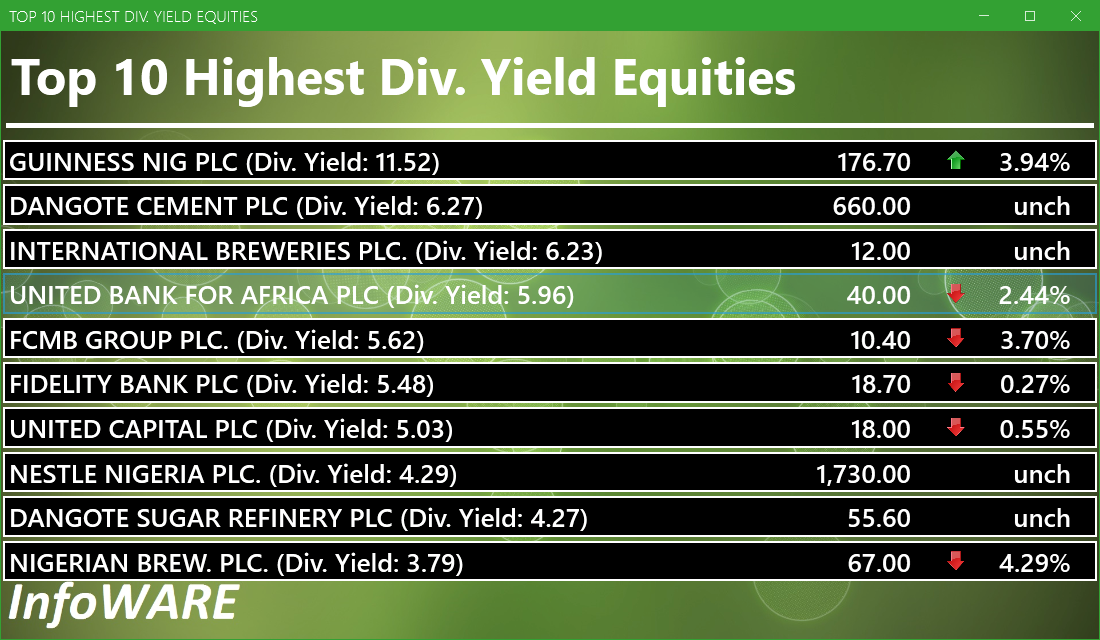
Investment Insights - High Div. Stocks
Dividend stocks distribute a portion of the company earnings to investors on a regular basis and they can a great choice for investors looking for regular income. As an investment or trading strategy, high dividend yield equities provide annual cash payments as against mostly capital gains in the price of a stock. The list in the table below represent the highest dividend paying stocks from the list of the most liquid stocks in the NSE top 30.
For more detailed analysis,
- On InfoWARE Market Data Terminal <HYIELD> <GO>
- On InfoWARE Finance Mobile App ( Android , iPhone & iPad and Windows 10) , "Research"
Investment Insights - Stocks outperforming the ASI but with approximately the same risk
These list of stocks represent equities that are less risky than the ASI but doing better than the ASI (All Shares Index) using the YTD (Year to Date) returns as the measure. The risk is measured by Beta. Beta is an assessment of a stock's tendency to undergo price changes, (its volatility), as well as its potential returns compared to the ASI. It is expressed as a ratio, where a score of 1 represents performance comparable to the ASI, and returns above or below the market may receive scores greater or lower than 1.
For a full list of both positively and negatively corelated stocks visit InfoWARE Market Data Terminal
- On InfoWARE Market Data Terminal <BANL> <GO>
- On InfoWARE Finance Mobile App ( Android , iPhone & iPad and Windows 10)
| Symbol | DivYield | PE | EPS | Beta | %ChgYTD | ASIYTDReturn | BetaDiff |
|---|---|---|---|---|---|---|---|
| HONYFLOUR | 1.40 | 16.28 | 0.31 | 0.99 | 216.47 | 44.92 | 0.01 |
| CAVERTON | 5.52 | 1.15 | 1.57 | 0.98 | 100.00 | 44.92 | 0.02 |
| ROYALEX | 7.81 | 0.00 | 0.00 | 0.96 | 72.73 | 44.92 | 0.04 |
| UNIVINSURE | 0.00 | 0.00 | 0.00 | 0.83 | 58.33 | 44.92 | 0.17 |
| FTNCOCOA | 1.60 | 0.00 | 0.00 | 0.79 | 155.32 | 44.92 | 0.21 |
| NB | 3.79 | 16.95 | 1.60 | 0.79 | 109.38 | 44.92 | 0.21 |
| MAYBAKER | 3.75 | 58.94 | 0.14 | 0.78 | 87.23 | 44.92 | 0.22 |
| UNILEVER | 2.81 | 67.09 | 0.40 | 0.75 | 108.33 | 44.92 | 0.25 |
| VETGOODS | 0.00 | 0.71 | 123.84 | 44.92 | 0.29 | ||
| VETGRIF30 | 0.00 | 0.71 | 48.34 | 44.92 | 0.29 |
African Markets
| Name | LClose | Change | %Chg |
|---|---|---|---|
| BRVM Stock Exchange | 337.34 | 2.78 | 0.83 |
| Botswana Stock Exchange | 10,616.43 | 34.92 | 0.33 |
| Egyptian Exchange | 39,949.66 | 817.85 | 2.09 |
| Ghana Stock Exchange | 8,227.84 | -54.66 | -0.66 |
| Lusaka Stock Exchange | 25,378.31 | -5.08 | -0.02 |
| Malawi Stock Exchange | 613,843.29 | -122.79 | -0.02 |
| Nigeria Stock Exchange | 150,026.55 | -542.05 | -0.36 |
| Nairobi Securities Exchange | 192.89 | 3.02 | 1.59 |
| Rwanda Stock Exchange | 179.09 | 0.00 | 0.00 |
| Tunis Stock Exchange | 12,729.73 | 48.19 | 0.38 |
| Uganda Securities Exchange | 1,560.37 | 2.03 | 0.13 |
Nigeria Market Indexes
| Symbol | LClose | %Chg | WTD% | MTD% | QTD% | YTD% | MktCap | Trades |
|---|---|---|---|---|---|---|---|---|
| ASI | 149,524.81 | -0.33 | -2.74 | -2.74 | 4.58 | 44.92 | 23,251 | |
| NGX30 | 5,481.56 | -0.32 | -2.77 | -2.77 | 5.05 | 43.69 | 13,290 | |
| NGXAFRBVI | 3,182.63 | -0.91 | -4.09 | -4.09 | -10.34 | 28.29 | 4,678 | |
| NGXAFRHDYI | 20,855.48 | -0.91 | -4.32 | -4.32 | -6.31 | 22.48 | 5,598 | |
| NGXASEM | 1,392.88 | 0.00 | 0.00 | 0.00 | -9.44 | -12.05 | 1 | |
| NGXBNK | 1,409.88 | -0.88 | -3.64 | -3.64 | -7.05 | 29.65 | 5,001 | |
| NGXCG | 3,916.98 | -0.78 | -4.18 | -4.18 | -3.31 | 38.45 | 12,104 | |
| NGXCNSMRGDS | 3,444.41 | -0.47 | -3.02 | -3.02 | 1.82 | 98.60 | 2,781 | |
| NGXCOMMDTY | 1,210.38 | 0.00 | 0.22 | 0.22 | 7.89 | 21.04 | ||
| NGXGROWTH | 14,387.93 | -7.46 | -7.22 | -7.22 | -4.54 | 85.34 | 505 | |
| NGXINDUSTR | 5,891.14 | -0.11 | -1.08 | -1.08 | 16.25 | 64.94 | 2,063 | |
| NGXINS | 1,138.08 | -2.15 | -6.18 | -6.18 | -4.85 | 44.76 | 1,491 | |
| NGXLOTUSISLM | 13,268.72 | -0.08 | -2.52 | -2.52 | 11.77 | 90.43 | 4,825 | |
| NGXMAINBOARD | 7,166.51 | -0.37 | -2.22 | -2.22 | 1.73 | 43.22 | 15,935 | |
| NGXMERIGRW | 9,993.13 | -1.23 | -3.17 | -3.17 | 0.91 | 53.19 | 3,181 | |
| NGXMERIVAL | 12,599.42 | -0.98 | -3.31 | -3.31 | -5.75 | 20.79 | 6,394 | |
| NGXOILGAS | 2,773.07 | -0.25 | -0.89 | -0.89 | 9.78 | 2.28 | 560 | |
| NGXPENBRD | 2,803.76 | -0.31 | -2.36 | -2.36 | 5.76 | 53.07 | 19,269 | |
| NGXPENSION | 6,723.51 | -0.65 | -3.32 | -3.32 | -0.21 | 48.29 | 14,991 | |
| NGXPREMIUM | 15,129.15 | -0.24 | -3.70 | -3.70 | 10.50 | 55.44 | 6,811 | |
| NGXSOVBND | 668.40 | 0.00 | 0.00 | 0.00 | 1.69 | 11.11 | 0 |
For more detailed analysis,
- On InfoWARE Market Data Terminal <MKTINS> <GO>
- On InfoWARE Finance Mobile App ( Android, iPhone & iPad and Windows 10) , "Market Indexes"
Find the topic interesting? Will like to comment? Contact Us at solutions@infowarelimited.com
Top News

InfoWARE AI Analyst Weekly Market Report: 07-Nov-2025
Chart Of The Day - ASI Chart Vs ASI Advance Decline Line (YTD) (07-Nov-2025 15:07:17.151)
InfoWARE AI Analyst Daily Market Report: 07-Nov-2025

[XNSA]>> NORRENBERGER MUTUAL FUNDS WEEKLY UPDATE
[MERVALUE]>> DAILY INDICATIVE PRICES
[LOTUSHAL15>> DAILY INDICATIVE PRICES
[VSPBONDETF]>> DAILY INDICATIVE PRICES
[XNSA]>> CORDROS MILESTONE FUNDS' BID & OFFER PRICES
[XNSA]>> NGX FIXED INCOME INDICATIVE PRICE LIST FOR NOV 07, 2025
[XNSA]>> H2 2025 BC/DR TEST
[XNSA]>> AELP CAPACITY BUILDING & ASSDA FORUM
[XNSA]>> FACTS BEHIND THE OFFER PRESENTATION BY ELLAH LAKES PLC
[XNSA]>> ACTIVATION OF CODE FOR TRADING IN RIGHTS
[SIAMLETF40]>> DAILY INDICATIVE PRICES
Chart Of The Day - ASI Chart Vs ASI Advance Decline Line (YTD) (06-Nov-2025 15:08:19.029)
InfoWARE AI Analyst Daily Market Report: 06-Nov-2025
[XNSA]>> APPOINTMENT OF DIRECTORS
[XNSA]>> DAILY FUND PRICE SUBMISSION - FCMB ASSET MANAGEMENT LIMITED
[VSPBONDETF]>> DAILY INDICATIVE PRICES
[XNSA]>> CORDROS MILESTONE FUNDS' BID & OFFER PRICES
[XNSA]>> NGX FIXED INCOME INDICATIVE PRICE LIST FOR NOV 06, 2025
[LOTUSHAL15]>> DAILY INDICATIVE PRICES
[XNSA]>> H2 2025 BC/DR TEST
[XNSA]>> AELP CAPACITY BUILDING & ASSDA FORUM
[STANBICETF30]>> DAILY INDICATIVE PRICES
Chart Of The Day - ASI Chart Vs ASI Advance Decline Line (YTD) (05-Nov-2025 15:08:47.129)
InfoWARE AI Analyst Daily Market Report: 05-Nov-2025
[XNSA]>> OFF MARKET TRADE
[VSPBONDETF]>> DAILY INDICATIVE PRICES
[LOTUSHAL15]>> DAILY INDICATIVE PRICES
Get IDIA - the stock trading app for the modern investor
Solutions by Business
Product Suites
Company
Contacts
- 8th Floor,
- South Atlantic Petroleum Towers,
- 1 Adeola Odeku Street,
- Victoria Island,
- Lagos, Nigeria.
- Email: solutions@infowarelimited.com
Follow Us
 |
 |
 |
 |