


InfoWARE AI Analyst Daily Market Report: 13-Nov-2025 | InfoWARE Finance
Get IDIA - the stock trading app for the modern investor


InfoWARE AI Analyst Daily Market Report: 13-Nov-2025
(Source: InfoWARE Terminal, Date: 13-Nov-2025)
Dear Investor,
NGX Daily Market Summary – Thursday, November 13, 2025
Market Recap:
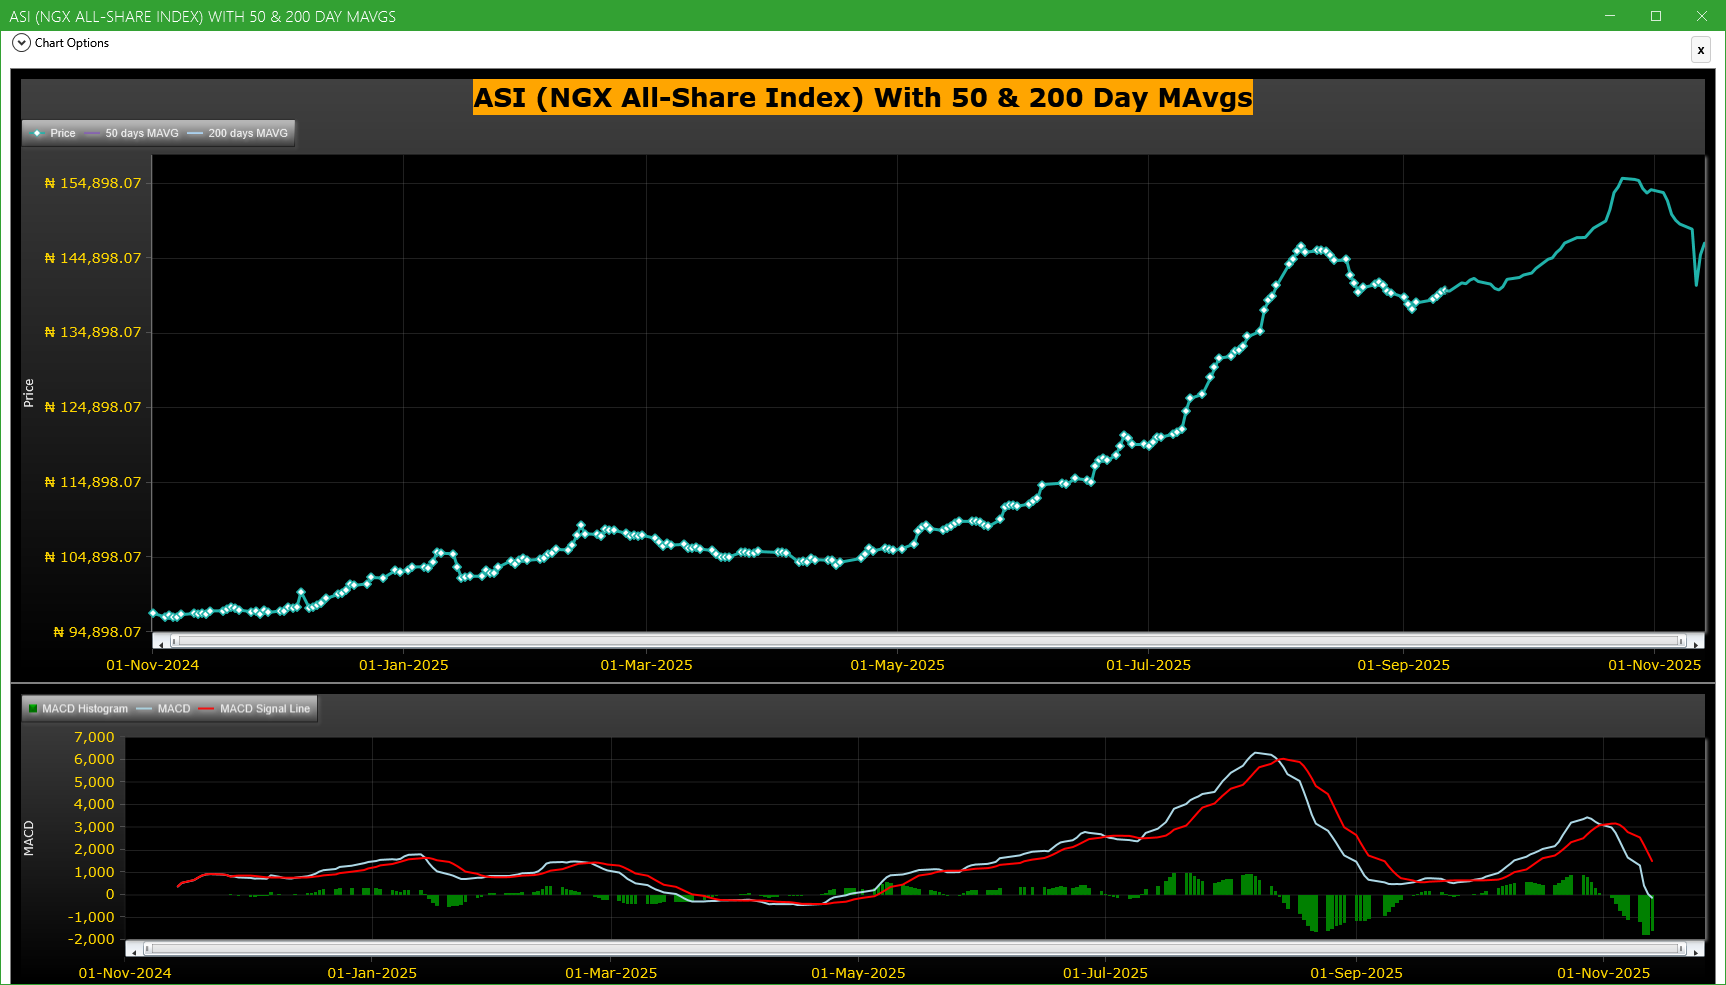
The Nigerian Equities market rebounded impressively as the NGX All Share Index (ASI) climbed by +1.08% to close at 145,403.83. However, the uptrend was accompanied by a pronounced -41.86% decline in market turnover (₦21.79B), and total traded volume fell to 574.81M from 771.33M—suggesting that the session’s bullish tilt lacked strong broad participation. Market breadth remains robust, with 59 advancers crushing 11 decliners (breadth ratio: 5.36x). The year-to-date return now sits at an impressive +42.45%. Notably, select banking and insurance counters as well as several ETFs saw surges in price and robust volumes, juxtaposed with some institutional profit-taking in large-cap names. On the currency front, the Naira gained marginally by +0.10% to close at ₦1,436/$.
📊 Key Market Trends
- Market Breadth: Advancers (59) outpaced decliners (11) by more than 5x, a strongly bullish breadth. However, volume was up in only 44 stocks while down in 94, hinting at leadership by few names.
- Turnover: The sharp turnover drop (-41.86%) even with a positive ASI, signals caution—gains were less "genuine,” pointing toward potential short-term profit taking or institutional rotation.
- Unusual Volume: WEMA BANK (+817% volume spike), STANBIC IBTC (+441%), and UBA (+148%) saw outsized trading—a possible clue to renewed accumulation or exit activity.
- Institutional Clustering: Institutional activity accounted for 91.4% of the day's traded value, with ZENITHBANK, DANGCEM, ACCESSCORP, UBA, and MTNN being focal points.
- Bullish Momentum: Bank-heavyweight ZENITHBANK and tier-1 lender UBA crossed above their 15DMA, confirming fresh buying interest among institutions—further corroborated by high volumes and institutional trade dominance in these tickers.
🔥 Top Gainers & Top Losers
| Symbol | Name | Close | % Chg | RSI | MACD | 15DMA |
|---|---|---|---|---|---|---|
| LINKASSURE | LINKAGE ASSURANCE PLC | 1.76 | +10.00% | 37.2 | -0.11 | 1.85 |
| STANBICETF30 | STANBIC IBTC ETF 30 | 676.5 | +10.00% | 66.7 | +22.56 | 543.9 |
| OANDO | OANDO PLC | 43.55 | +9.97% | 41.9 | -1.68 | 42.6 |
| CUSTODIAN | CUSTODIAN AND ALLIED PLC | 38.5 | -10.00% | 31.5 | -1.30 | 40.6 |
| AUSTINLAZ | AUSTIN LAZ & CO PLC | 2.35 | -9.96% | 28.4 | -0.03 | 2.84 |
- LINKASSURE's ceiling move (+10%) came with an RSI below 40 and no clear bullish MACD—momentum may be fleeting.
- STANBIC IBTC ETF 30 matched institutional activity spike with +10% move and an elevated RSI (66.7), approaching overbought territory.
- CUSTODIAN reversed sharply (-10%) and now sits at RSI 31.5—potentially near a technical bottom/oversold zone.
- OANDO continues a rising streak, closing above its 15DMA with strong institutional inflows.
📈 YTD Table Highlights & Momentum Insights
| YTD Gainers | YTD Change | RSI | MACD |
|---|---|---|---|
| NCR | +324.5% | 94.1 (Overbought) | +1.32 |
| ELLAHLAKES | +315.3% | 47.36 | -0.50 |
| FTNCOCOA | +165.96% | 39.5 | -0.31 |
| REGALINS | +56.25% | 40.5 | -0.096 |
| ROYAL EXCHANGE PLC | +86.36% | 41.1 | -0.095 |
| YTD Losers | YTD Change | RSI | MACD |
|---|---|---|---|
| GREENWETF | -35.11% | 46.6 | +12.74 |
| TRANSPOWER | -14.48% | 25.8 (Oversold) | +2.50 |
| VETGOODS | -6.86% | 30.0 | +0.09 |
| UNIONDICON | -2.78% | 42.5 | -0.26 |
- NCR stands out with a +324.5% YTD return and an RSI well above 90, historically signaling extreme overbought conditions—contrarian caution advised.
- TRANSPOWER at a -14.48% YTD decline with an RSI of 25.8 (oversold) may be primed for a technical relief rally.
- STANBIC IBTC ETF 30 not only leads the daily gainers but also maintains strong 5-day momentum, supported by high RSI and MACD readings.
- REGALINS and ROYAL EXCHANGE are "momentum favorites”, both featuring on top 5 YTD gainers, crossing their 15DMA, and showing up in bullish momentum lists.
🚦 Momentum Watch: RSI & Moving Average Crossovers
-
Bullish Momentum:
- ZENITHBANK (institutional action, RSI: ~40, above 15DMA/50DMA, bullish MACD) – strong upward technical realignment and big-money flows.
- UBA (High volume, 15DMA breakout, RSI in the upper-30s/40s).
- DEAPCAP and MCNICHOLS show strong price breaks above key moving averages, albeit with more speculative profiles.
- ASOSAVINGS (10% dividend yield) crosses 15DMA with price surge—a value yield-hunter’s momentum play.
-
Bearish Momentum:
- STERLINGNG: Down -5.81% today, losing 15DMA support, high Beta (1.41), and neutral RSI; could be entering a real technical downtrend.
- FCMB: Slight decline, but currently not at an RSI extreme.
🧩 Contrarian Signals
- CUSTODIAN AND ALLIED PLC: Down -10% on the day, but RSI is at 31.5 (near oversold) while MACD is negative—worth watching for a potential bounce if seller exhaustion emerges.
- NCR: YTD outlier with a +324% gain and RSI 94 suggests over-extension. Short-term caution possible.
- GUINNESS NIG PLC: Losses -5.14% with an RSI of 49 and negative price momentum, but MACD is positive—could portend a sharp reversal.
- REGALINS: Firm YTD gainer but Thursday’s MACD remains negative, pointing to hidden vulnerability despite longer-term trend.
- High Dividend, Bearish Signal Combo: FCMB holds a 5.62% yield, trading below 15DMA—watch for reversal setups.
🏦 Sector Heatmap & Institutional/Retail Pulse
| Sector | Gainers | Losers | Top Traded Stock | Major Activity | Retail % | Institutional % | Trend |
|---|---|---|---|---|---|---|---|
| Banking | ZENITHBANK, UBA, ACCESSCORP, WEMABANK (U.V.) | STERLINGNG, FCMB | ZENITHBANK | Strong Inst. Flows | 16% | 84% | Bullish (15DMA ↑) |
| Insurance | LINKASSURE, REGALINS, ROYALEX | None notable | LASACO | Unusual Volumes | 40% | 60% | Mixed, short-term hot |
| Other Financials | STANBIC, DEAPCAP | None notable | STANBIC | Huge U.V. | 20% | 80% | Bullish Momentum |
| Industrial | None notable | DANGCEM (-10%) | DANGCEM | Profit taking | 12% | 88% | Bearish Reversal |
| Consumer Goods | NB (+5.65%) | GUINNESS | NB | Stable | 55% | 45% | Mixed |
🧮 Dividend–Beta Matrix: Defensive Opportunities
| Symbol | Div. Yield | Beta | Momentum |
|---|---|---|---|
| ASOSAVINGS | 10.00% | 0.00 | Bullish (15DMA↑) |
| REGALINS | 6.52% | 0.468 | Bullish YTD/15DMA↑ |
| FCMB | 5.62% | 1.17 | Bearish (15DMA↓) |
| ROYALEX | 7.81% | 0.961 | Bullish (YTD/15DMA↑) |
| ZENITHBANK | 2.25% | 1.20 | Inst. Bullish/Trend ↑ |
- Defensive Income Picks: ASOSAVINGS, REGALINS, ROYALEX combine high yield with low-to-moderate beta and confirmed technical or YTD strength, offering potential value for risk-off investors.
- Beware stocks like FCMB; while yield is high, current price momentum is negative.
🏛️ Institutional Clustering Alert
- ZENITHBANK: Dominated institutional trade activity (20.17% of value share), with high volume, positive trend, and cross-above on 15DMA—indicating strong confidence from big players.
- MTNN, DANGCEM, ACCESSCORP, UBA: also enjoyed outsized institutional flows.
🔍 Analysis From Market Activity Summaries
- Trade Breakdown: Retail investors accounted for 63.9% of trade count but just 8.6% of value—clear evidence that "smart money” (institutionals) led with larger tickets, focusing on ZENITHBANK, DANGCEM, and ACCESSCORP.
- Correlation Patterns: Stocks with both high institutional volumes and bullish technicals (ZENITHBANK, STANBIC, UBA) outperformed—suggests following institutional cues yields alpha.
- Top Traded (Retail): MTNN, ZENITHBANK, ACCESSCORP, GTCO, DANGCEM. The overlap with institutional-traded stocks (ZENITHBANK, ACCESSCORP, MTNN, DANGCEM) shows convergence in market focus but institutions dictate value and direction.
- Unusual Volume Watch: WEMABANK & STANBIC may see volatility continue near term as both sides ("dumb” and "smart” money) pile in.
💡 Noteworthy & Hidden Market Insights
- Market rally was "narrow”—select banking/ETF names drove gains, but broad traded value/volume faded. Traders might exercise caution until volume confirms breadth.
- Bullish crossovers (15DMA/50DMA) were concentrated in large cap banks and financials, signalling sector leadership may rotate back into banks near-term.
- Contrarian risk in top YTD gainers (NCR – high RSI, overextension alert) and several oversold names (CUSTODIAN, TRANSPOWER) may offer locational opportunities for mean reversion traders.
- Dividend captures: ROYALEX, REGALINS, and ASOSAVINGS provide both yield and technical confirmation—possible strategic additions for risk-averse, income-focused investors.
🕵️ Trading Suggestions
- Momentum traders: Focus on ZENITHBANK, UBA, STANBIC, and OANDO—confirmed volume and technical signals support further upside. Trail stops recommended as turnover contraction hints at possible profit-taking pressures ahead.
- Contrarians: Screen for possible rebound candidates in CUSTODIAN and TRANSPOWER (oversold zone), while remaining cautious around overbought names (NCR, STANBICETF30—gauged by RSI).
- Rotation Watch: If volume/turnover resumes, expect laggard sectors (Industrial/Consumer Goods) to catch up. But in absence of strong flows, stick with bank/financial leaders.
- Income investors: Consider REGALINS, ROYALEX or ASOSAVINGS as their healthy yield, low beta, and upward momentum provide both stability and appreciation potential.
|
Top ASI Gainers Over Last 5 Trading Days
|
Top ASI Losers Over Last 5 Trading Days
|
For more detailed analysis, on InfoWARE Market Data Terminal <NSEPERF> <GO>
On InfoWARE Finance Mobile App (Android, iPhone & iPad, Windows Phone and Windows 8/10), "Top Gainers & Losers"
LINKAGE ASSURANCE PLC (LINKASSURE) topped the advancers list closing at N1.76 with a gain of 10.00% followed by CUSTODIAN AND ALLIED PLC (CUSTODIAN) which closed at N38.50 with a gain of 10.00%.
On the flip side AUSTIN LAZ & COMPANY PLC (AUSTINLAZ) and UNION DICON SALT PLC. (UNIONDICON) topped the decliners log with a loss of -9.96% at a close of N2.35, and -9.68% to close the day at N7.00 respectively.
| Symbol | LClose | %Chg |
|---|---|---|
| LINKASSURE | 1.76 | 10.00 |
| CUSTODIAN | 38.50 | 10.00 |
| STANBICETF30 | 676.50 | 10.00 |
| OANDO | 43.55 | 9.97 |
| LEGENDINT | 5.74 | 9.96 |
| Symbol | LClose | %Chg |
|---|---|---|
| AUSTINLAZ | 2.35 | -9.96 |
| UNIONDICON | 7.00 | -9.68 |
| LOTUSHAL15 | 85.35 | -8.03 |
| STERLINGNG | 7.30 | -5.81 |
| NGXGROUP | 52.60 | -5.31 |
For more detailed analysis,
- On InfoWARE Market Data Terminal <TOPG> <GO>
- On InfoWARE Finance Mobile App ( Android, iPhone & iPad and Windows 10) , "Top Gainers & Losers"
Currency Market
In the currency market, the Naira appreciated 0.10%(1.47) against the Dollar to settle at 1 to 1NSE: Bull Signal - Price crossed above 15 Day MA
This signal implies these stocks are under buying pressure and the price might continue to rise and therefore positions should be monitored closely. Further suggested analysis include looking at the overall market (ASI) to see if the uptrend is market wide, sector wide or specific to the stock. Portfolio managers tend to use this as a signal to do more research to add to their positions or lock in some profits. Typically further analysis should be done using commands like PC and RV on the InfoWARE Market Data Terminal. Another command is ALERTS to set price triggers for possible exit or entry as necessary
For more detailed analysis,
- On InfoWARE Market Data Terminal <NSEPERF> <GO>
- On InfoWARE Finance Mobile App ( Android , iPhone & iPad and Windows 10) , "Top Gainers & Losers"
| Symbol | Price | %Chg | 15DMA | PE | EPS | DivY | MktCap | Vol | Trades | Value | LstTradeTime |
|---|---|---|---|---|---|---|---|---|---|---|---|
| FGS202791 | 100.00 | 30.00 | 88.00 | 0.00 | 0.00 | 500.00 | 1.00 | 500.00K | 13-Nov-2025 14:30:15.477 | ||
| OANDO | 43.55 | 9.07 | 42.59 | 24.10 | 2.53 | 1.15 | 541.39B | 5.38M | 626.00 | 232.83M | 13-Nov-2025 14:30:12.090 |
| LEGENDINT | 5.74 | 9.06 | 5.54 | 0.00 | 0.00 | 3.35M | 102.00 | 19.02M | 13-Nov-2025 14:30:11.560 | ||
| CHAMS | 3.47 | 8.93 | 3.43 | 27.02 | 0.07 | 1.56 | 16.30B | 8.05M | 243.00 | 26.49M | 13-Nov-2025 14:30:31.013 |
| REGALINS | 1.25 | 8.80 | 1.21 | 4.35 | 0.11 | 6.52 | 8.34B | 1.02M | 40.00 | 1.27M | 13-Nov-2025 14:30:12.303 |
| ROYALEX | 2.05 | 8.78 | 2.00 | 0.00 | 0.00 | 7.81 | 10.55B | 5.62M | 119.00 | 11.47M | 13-Nov-2025 14:30:12.317 |
| ASOSAVINGS | 0.94 | 8.51 | 0.91 | 35.46 | 0.01 | 10.00 | 13.86B | 11.26M | 202.00 | 10.51M | 13-Nov-2025 14:30:10.253 |
| ZENITHBANK | 64.40 | 7.76 | 61.90 | 3.33 | 13.30 | 2.25 | 2,021.93B | 40.77M | 1,731.00 | 2.63B | 13-Nov-2025 14:30:33.513 |
| DEAPCAP | 1.81 | 7.73 | 1.73 | 188.84 | 0.01 | 13.76 | 2.72B | 955.51K | 47.00 | 1.64M | 13-Nov-2025 14:30:10.827 |
| MCNICHOLS | 3.02 | 7.28 | 3.00 | 26.80 | 0.05 | 5.88 | 2.17B | 5.76M | 81.00 | 17.30M | 13-Nov-2025 14:30:33.740 |
| NPFMCRFBK | 2.99 | 6.69 | 2.95 | 5.63 | 0.27 | 8.00 | 17.92B | 2.25M | 46.00 | 6.65M | 13-Nov-2025 14:30:12.047 |
| CORNERST | 6.20 | 6.61 | 6.04 | 8.62 | 0.35 | 5.28 | 112.63B | 361.64K | 31.00 | 2.24M | 13-Nov-2025 14:30:10.643 |
| UBA | 41.00 | 6.46 | 39.62 | 8.29 | 4.05 | 5.96 | 1,402.18B | 52.97M | 911.00 | 2.21B | 13-Nov-2025 14:30:33.503 |
| FTNCOCOA | 5.00 | 6.00 | 4.94 | 0.00 | 0.00 | 1.60 | 19.50B | 4.85M | 169.00 | 24.13M | 13-Nov-2025 14:30:11.123 |
| NB | 69.95 | 5.65 | 69.32 | 16.95 | 1.60 | 3.79 | 718.82B | 951.20K | 266.00 | 66.59M | 13-Nov-2025 14:30:11.870 |
| NGXAFRBVI | 3,314.69 | 5.31 | 3,242.39 | 3.14 | 35.50 | 0.00 | 0.00 | 177.03M | 5,460.00 | 9.37B | 13-Nov-2025 14:30:16.027 |
| PZ | 40.65 | 5.29 | 40.00 | 44.17 | 0.50 | 4.59 | 161.40B | 6.89M | 223.00 | 272.79M | 13-Nov-2025 14:30:12.270 |
| STANBIC | 110.00 | 4.55 | 109.75 | 6.87 | 8.23 | 3.54 | 1,425.27B | 23.64M | 220.00 | 2.58B | 13-Nov-2025 14:30:12.443 |
| ACCESSCORP | 23.00 | 4.35 | 22.89 | 8.56 | 2.81 | 1.87 | 817.54B | 50.89M | 1,386.00 | 1.17B | 13-Nov-2025 14:30:33.493 |
| UCAP | 18.40 | 4.35 | 17.91 | 19.15 | 0.93 | 5.03 | 110.40B | 2.41M | 191.00 | 44.02M | 13-Nov-2025 14:30:12.653 |
| NGXMERIVAL | 12,980.00 | 4.05 | 12,823.90 | 12.13 | 38.38 | 0.00 | 0.00 | 203.30M | 6,570.00 | 8.75B | 13-Nov-2025 14:30:16.273 |
| NGXBNK | 1,447.90 | 3.67 | 1,433.33 | 6.10 | 34.65 | 0.00 | 0.00 | 294.24M | 5,326.00 | 8.81B | 13-Nov-2025 14:30:16.100 |
| NGXAFRHDYI | 21,401.50 | 3.25 | 21,182.10 | 7.46 | 39.30 | 0.00 | 0.00 | 114.58M | 6,318.00 | 7.72B | 13-Nov-2025 14:30:16.040 |
| GTCO | 88.50 | 3.05 | 87.36 | 7.49 | 7.10 | 1.88 | 2,604.66B | 8.76M | 1,212.00 | 776.31M | 13-Nov-2025 14:30:11.193 |
| ELLAHLAKES | 12.50 | 2.96 | 12.23 | 0.00 | 0.00 | 0.00 | 25.00B | 19.76M | 595.00 | 251.09M | 13-Nov-2025 14:30:10.893 |
| JAIZBANK | 4.50 | 2.22 | 4.44 | 83.05 | 0.03 | 1.67 | 155.44B | 6.58M | 230.00 | 29.67M | 13-Nov-2025 14:30:34.673 |
| NGXMERIGRW | 10,187.80 | 1.07 | 10,148.55 | 34.89 | 293.99 | 0.00 | 0.00 | 55.18M | 2,891.00 | 5.07B | 13-Nov-2025 14:30:16.260 |
NSE: BEAR Signal - Price crossed below 15 Day MA
This signal implies these stocks are under selling pressure and the price might continue to slide and therefore positions should be monitored closely. Further suggested analysis include looking at the overall market (ASI) to see if the downtrend is market wide, sector wide or specific to the stock. If the overal market trend is upwards, then since these stocks are heading in the opposite direction, then further analysis should be done using commands like PC and RV on the InfoWARE Market Data Terminal. Another command is ALERTS to set price triggers for possible exit is necessar
For more detailed analysis,
- On InfoWARE Market Data Terminal <BEARM> <GO>
- On InfoWARE Finance Mobile App ( Android , iPhone & iPad and Windows 10)
| Symbol | Price | %Chg | 15DMA | PE | EPS | DivY | MktCap | Vol | Trades | Value | LstTradeTime |
|---|---|---|---|---|---|---|---|---|---|---|---|
| FCMB | 10.50 | -0.95 | 10.53 | 104.31 | 0.09 | 5.62 | 207.93B | 4.07M | 497.00 | 42.42M | 13-Nov-2025 14:30:31.023 |
| STERLINGNG | 7.30 | -6.16 | 7.65 | 15.75 | 0.30 | 3.19 | 210.17B | 3.30M | 312.00 | 24.58M | 13-Nov-2025 14:30:12.460 |
Market Trend - ASI (NGX All-Share-Index) With 50 & 200 Day MAvgs Chart
Technical traders typically use the 50 & 200 day moving averages to aid in choosing
where to enter or exit a position, which then causes these levels to act as strong
support or resistance. As a general guideline, if the price is above a moving average,
the trend is up. If the price is below a moving average, the trend is down.
It is important to note that critics of technical analysis say that moving averages act
as support and resistance because so many traders use these indicators to inform their
trading decisions. Also moving averages tend to work quite well in strong trending conditions
but poorly in choppy or ranging conditions.
Trading Strategies: Crossovers
Crossovers are one of the main moving average strategies. The first type is a price crossover,
which is when the price crosses above or below a moving average to signal a potential change
in trend. Another strategy is to apply two moving averages to a chart: one longer and one
shorter. When the shorter-term MA crosses above the longer-term MA, it is a buy signal, as
it indicates that the trend is shifting up. This is known as a golden cross. Meanwhile, when
the shorter-term MA crosses below the longer-term MA, it is a sell signal, as it indicates that
the trend is shifting down. This is known as a dead/death cross
For more detailed analysis,
- On InfoWARE Market Data Terminal <CI> <GO>
- On InfoWARE Finance Mobile App ( Android , iPhone & iPad and Windows 10) , "Research"
Unusual Volume: Volume traded is more than double the 90 day moving average (All exchanges; ASI & ASem). For more detailed analysis,
- On InfoWARE Market Data Terminal <UV> <GO>
- On InfoWARE Finance Mobile App ( Android , iPhone & iPad and Windows 10)
| Symbol | Name | Volume | 90DAvgVol | %VolChg | Price | LClose | %Chg | Trades | Value |
|---|---|---|---|---|---|---|---|---|---|
| WEMABANK | WEMA BANK PLC. | 98.43M | 10.73M | 817.07 | 19.80 | 19.80 | 0.00 | 263 | 1.95B |
| UBA | UNITED BANK FOR AFRICA PLC | 52.97M | 21.38M | 147.81 | 41.00 | 38.35 | 6.91 | 911 | 2.21B |
| STANBIC | STANBIC IBTC HOLDINGS PLC | 23.64M | 4.37M | 441.48 | 110.00 | 105.00 | 4.76 | 220 | 2.58B |
| LASACO | LASACO ASSURANCE PLC. | 23.44M | 8.88M | 163.98 | 2.50 | 2.28 | 9.65 | 81 | 58.57M |
| MANSARD | MANSARD INSURANCE PLC | 7.35M | 3.09M | 137.49 | 13.00 | 13.31 | -2.33 | 151 | 96.73M |
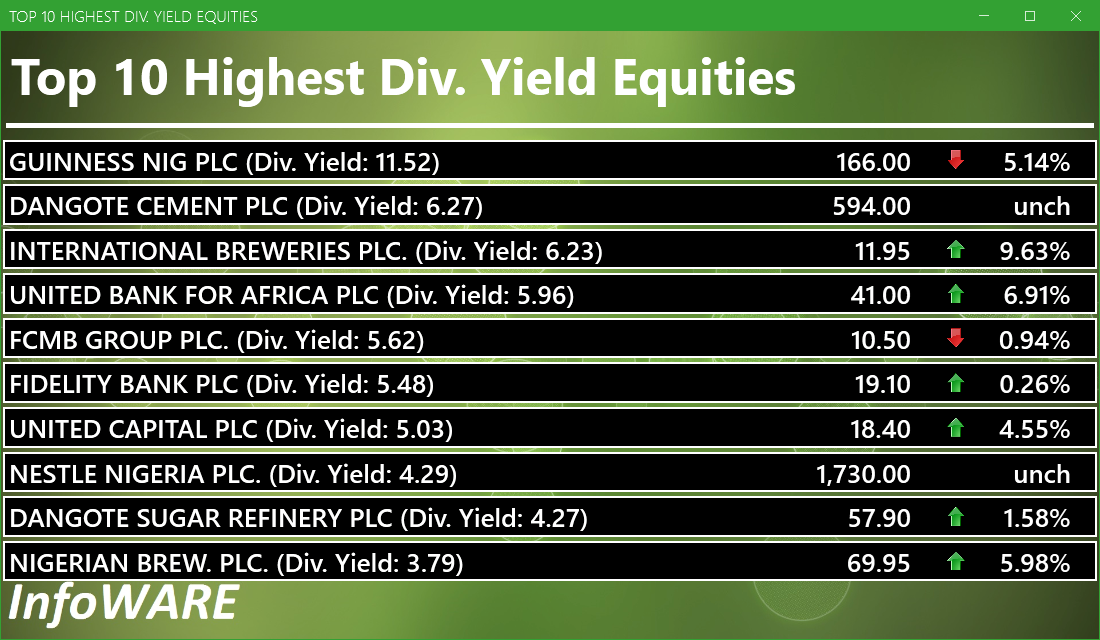
Investment Insights - High Div. Stocks
Dividend stocks distribute a portion of the company earnings to investors on a regular basis and they can a great choice for investors looking for regular income. As an investment or trading strategy, high dividend yield equities provide annual cash payments as against mostly capital gains in the price of a stock. The list in the table below represent the highest dividend paying stocks from the list of the most liquid stocks in the NSE top 30.
For more detailed analysis,
- On InfoWARE Market Data Terminal <HYIELD> <GO>
- On InfoWARE Finance Mobile App ( Android , iPhone & iPad and Windows 10) , "Research"
African Markets
| Name | LClose | Change | %Chg |
|---|---|---|---|
| BRVM Stock Exchange | 337.37 | -0.27 | -0.08 |
| Botswana Stock Exchange | 10,620.30 | 0.00 | 0.00 |
| Egyptian Exchange | 40,228.76 | -32.21 | -0.08 |
| Ghana Stock Exchange | 8,173.66 | 1.63 | 0.02 |
| Johannesburg Stock Exchange | 112,908.50 | 1,723.37 | 1.55 |
| Lusaka Stock Exchange | 25,523.23 | -30.66 | -0.12 |
| Casablanca Stock Exchange | 18,668.96 | 44.70 | 0.24 |
| Malawi Stock Exchange | 636,322.66 | 889.61 | 0.14 |
| Nigeria Stock Exchange | 145,403.83 | 4,070.40 | 2.88 |
| Nairobi Securities Exchange | 187.12 | -1.83 | -0.97 |
| Namibian Stock Exchange | 2,018.47 | 33.94 | 1.71 |
| Rwanda Stock Exchange | 179.12 | 0.04 | 0.02 |
| Tunis Stock Exchange | 12,864.15 | 43.59 | 0.34 |
| Uganda Securities Exchange | 1,633.03 | 2.93 | 0.18 |
Nigeria Market Indexes
| Symbol | LClose | %Chg | WTD% | MTD% | QTD% | YTD% | MktCap | Trades |
|---|---|---|---|---|---|---|---|---|
| ASI | 146,981.17 | 1.08 | -1.24 | -4.40 | 2.80 | 42.45 | 22,092 | |
| NGX30 | 5,387.24 | 1.08 | -1.36 | -4.45 | 3.24 | 41.22 | 13,203 | |
| NGXAFRBVI | 3,314.69 | 5.61 | 5.62 | -0.11 | -6.62 | 33.61 | 5,460 | |
| NGXAFRHDYI | 21,401.50 | 3.36 | 4.10 | -1.82 | -3.86 | 25.69 | 6,318 | |
| NGXASEM | 1,392.88 | 0.00 | 0.00 | 0.00 | -9.44 | -12.05 | 4 | |
| NGXBNK | 1,447.90 | 3.80 | 3.37 | -1.04 | -4.54 | 33.15 | 5,326 | |
| NGXCG | 3,981.67 | 2.80 | 2.31 | -2.59 | -1.71 | 40.73 | 12,685 | |
| NGXCNSMRGDS | 3,458.16 | 1.73 | 1.75 | -2.63 | 2.23 | 99.39 | 2,776 | |
| NGXCOMMDTY | 1,184.90 | 0.00 | -2.10 | -1.89 | 5.62 | 18.49 | ||
| NGXGROWTH | 14,335.20 | 0.18 | 0.11 | -7.56 | -4.89 | 84.66 | 384 | |
| NGXINDUSTR | 5,405.54 | -0.09 | -8.23 | -9.24 | 6.66 | 51.35 | 2,573 | |
| NGXINS | 1,166.15 | 4.58 | 7.00 | -3.86 | -2.50 | 48.33 | 1,053 | |
| NGXLOTUSISLM | 13,013.05 | 0.37 | -1.52 | -4.40 | 9.62 | 86.76 | 4,705 | |
| NGXMAINBOARD | 7,085.36 | 1.09 | -0.59 | -3.32 | 0.58 | 41.60 | 14,423 | |
| NGXMERIGRW | 10,187.80 | 1.08 | 2.10 | -1.28 | 2.87 | 56.18 | 2,891 | |
| NGXMERIVAL | 12,980.00 | 4.22 | 4.51 | -0.39 | -2.90 | 24.44 | 6,570 | |
| NGXOILGAS | 2,770.93 | 0.65 | -0.08 | -0.97 | 9.70 | 2.21 | 391 | |
| NGXPENBRD | 2,752.29 | 0.88 | -1.55 | -4.15 | 3.82 | 50.26 | 18,397 | |
| NGXPENSION | 6,767.23 | 1.90 | 1.15 | -2.69 | 0.44 | 49.25 | 15,106 | |
| NGXPREMIUM | 14,711.42 | 1.08 | -2.45 | -6.36 | 7.45 | 51.15 | 7,285 | |
| NGXSOVBND | 669.17 | 0.03 | 0.12 | 0.12 | 1.81 | 11.24 | 1 |
For more detailed analysis,
- On InfoWARE Market Data Terminal <MKTINS> <GO>
- On InfoWARE Finance Mobile App ( Android, iPhone & iPad and Windows 10) , "Market Indexes"
Find the topic interesting? Will like to comment? Contact Us at solutions@infowarelimited.com
Top News

Chart Of The Day - ASI Chart Vs ASI Advance Decline Line (YTD) (13-Nov-2025 15:08:15.857)
InfoWARE AI Analyst Daily Market Report: 13-Nov-2025

[MERVALUE]>> DAILY INDICATIVE PRICES
[VSPBONDETF]>> DAILY INDICATIVE PRICES
[LOTUSHAL15]>> DAILY INDICATIVE PRICES
[XNSA]>> GREENWICH SECURITIES LIMITED - RESIGNATION OF A DIRECTOR
[XNSA]>> NGX FIXED INCOME INDICATIVE PRICE LIST FOR NOV 13, 2025
[XNSA]>> ECL ASSET MANAGEMENT LIMITED - APPOINTMENT OF DIRECTORS
[XNSA]>> CORDROS MILESTONE FUNDS' BID & OFFER PRICES
[XNSA]>> H2 2025 BC/DR TEST
[XNSA]>> AELP CAPACITY BUILDING & ASSDA FORUM
Chart Of The Day - ASI Chart Vs ASI Advance Decline Line (YTD) (12-Nov-2025 15:09:11.364)
InfoWARE AI Analyst Daily Market Report: 12-Nov-2025
[MERVALUE]>> DAILY INDICATIVE PRICES
[VETGOODS]>> DAILY INDICATIVE PRICES
[XNSA]>> NGX FIXED INCOME INDICATIVE PRICE LIST FOR NOV 12, 2025
[XNSA]> CORDROS MILESTONE FUNDS' BID & OFFER PRICES
[XNSA]>> H2 2025 BC/DR TEST
[XNSA]>> AELP CAPACITY BUILDING & ASSDA FORUM
[LOTUSHAL15]>> DAILY INDICATIVE PRICES
[XNSA]>> NOTIFICATION OF PRICE ADJUSTMENT
[STANBICETF30]>> DAILY INDICATIVE PRICES
Chart Of The Day - ASI Chart Vs ASI Advance Decline Line (YTD) (11-Nov-2025 15:08:12.741)
InfoWARE AI Analyst Daily Market Report: 11-Nov-2025
[XNSA]>> RESIGNATION OF A DIRECTOR
[VETBANK]>> DAILY INDICATIVE PRICES
[XNSA]>> H2 2025 BC/DR TEST
[XNSA]>> NGX FIXED INCOME INDICATIVE PRICE LIST FOR NOV 11, 2025
[XNSA]>> AELP CAPACITY BUILDING & ASSDA FORUM
[XNSA]>> LISTING OF MINISTRY OF FINANCE INCORPORATED SERIES 2 FUND
Get IDIA - the stock trading app for the modern investor
Solutions by Business
Product Suites
Company
Contacts
- 8th Floor,
- South Atlantic Petroleum Towers,
- 1 Adeola Odeku Street,
- Victoria Island,
- Lagos, Nigeria.
- Email: solutions@infowarelimited.com
Follow Us
 |
 |
 |
 |