


InfoWARE AI Analyst Daily Market Report: 25-Nov-2025 | InfoWARE Finance
Get IDIA - the stock trading app for the modern investor


InfoWARE AI Analyst Daily Market Report: 25-Nov-2025
(Source: InfoWARE Terminal, Date: 25-Nov-2025)
Dear Investor,
NGX Daily Market Summary – Tuesday, November 25, 2025
The NGX All Share Index inched up by 0.10% today, closing at 143,614.61. Despite the uptick, market turnover slowed sharply by -45.54% to ₦15.33B, and trading volumes also dipped versus the prior session (458.61M vs 685.35M). Market breadth favored bulls, with 31 advancers versus 21 decliners (breadth ratio 1.48x), indicating a healthy spread in rising stocks. The YTD return for the NGX sits at a robust 39.33%—well ahead of inflation and most regional peers. Top gainer NCR (NIGERIA) PLC. soared nearly +10% on outsized momentum, while IKEJA HOTEL PLC suffered nearly a -10% loss. Sector rotation, institutional drifts, and technical crossovers paint a nuanced picture, underpinned by both opportunity and caution.
Key Market Trends & Breadth
- Market Breadth: 31 advancers, 21 decliners – bullish skew, signaling underlying support even on lower volumes.
- Turnover Decline: Sharp fall in traded value (-45.54% vs previous day) suggests institutional investors may be on the sidelines, potentially pausing after a strong YTD rally.
- Volume Patterns: Volumes up for 58 companies, down for 85 – breadth positive, but momentum mixed beneath the surface.
-
High Volume Alerts:
- FIRSTHOLDCO saw a staggering +422.0% spike in volume.
- NEM surged +1587.2% over its 90-day average.
- STANBIC IBTC volume up +501.9%.
Top 5 Daily Gainers and Losers
| Symbol | Name | Chg (%) | RSI | MACD |
|---|---|---|---|---|
| NCR | NCR (NIGERIA) PLC. | +9.98 | 99.07 | 5.90 |
| Ikejahotel | IKEJA HOTEL PLC | +9.86 | 60.12 | 0.23 |
| PRESTIGE | PRESTIGE ASSURANCE CO. PLC. | +9.56 | 40.64 | -0.06 |
| EUNISELL | EUNISELL INTERLINKED PLC | +9.49 | 78.50 | 7.90 |
| STERLINGNG | STERLING FINANCIAL HOLDINGS | +8.96 | 36.16 | -0.15 |
| Symbol | Name | Chg (%) | RSI | MACD |
|---|---|---|---|---|
| UNIONDICON | UNION DICON SALT PLC. | -10.00 | 39.74 | -0.39 |
| CAVERTON | CAVERTON OFFSHORE SUPPORT | -10.00 | 49.99 | -0.21 |
| SUNUASSUR | SUNU ASSURANCES NIGERIA | -4.78 | 42.54 | -0.18 |
| LASACO | LASACO ASSURANCE PLC. | -4.58 | 49.05 | -0.06 |
| MANSARD | MANSARD INSURANCE PLC | -4.23 | 39.62 | -0.63 |
Year-To-Date (YTD) Top Gainers and Losers
| Name | Symbol | Price | Chg YTD (%) | RSI |
|---|---|---|---|---|
| NCR (NIGERIA) PLC. | NCR | 41.10 | +721.82 | 99.07 |
| Ikeja Hotel PLC | Ikejahotel | 20.80 | +85.02 | 60.12 |
| NEWGOLD ETF | NEWGOLD | 55100.00 | +97.58 | 50.02 |
| UACN PLC | UACN | 71.10 | +131.26 | 63.93 |
| SIAML ETF40 | SIAMLETF40 | 660.00 | -17.50 | 89.31 |
| Name | Symbol | Price | Chg YTD (%) | RSI |
|---|---|---|---|---|
| SECURE ELECTRONIC TECH | NSLTECH | 0.80 | +11.59 | 44.45 |
| WAPIC INSURANCE PLC | WAPIC | 2.43 | -1.62 | 35.35 |
| CAVERTON SUPPORT GROUP | CAVERTON | 5.50 | +94.12 | 49.99 |
| UNION DICON SALT | UNIONDICON | 7.00 | -12.50 | 39.74 |
| LEGEND INTERNET PLC | LEGENDINT | 5.26 | -15.16 | 44.04 |
Bullish & Bearish Momentum (15DMA Crossovers)
| Symbol | Name | Chg (%) | RSI | MACD |
|---|---|---|---|---|
| PRESTIGE | PRESTIGE ASSURANCE | 8.72 | 40.64 | -0.06 |
| DAARCOMM | DAAR COMMUNICATIONS | 8.08 | --- | --- |
| ROYALEX | ROYAL EXCHANGE | 7.54 | --- | --- |
| NAHCO | NIG. AVIATION HANDLING CO | 6.90 | --- | --- |
| FIRSTHOLDCO | FIRST HOLDCO PLC | 1.45 | --- | --- |
| GTCO | GUARANTY TRUST HOLDCO | 1.40 | --- | --- |
| Symbol | Name | Chg (%) | RSI | MACD |
|---|---|---|---|---|
| UPDC | UPDC PLC | 0.00 | --- | --- |
| VFDGROUP | VFD GROUP PLC | -1.92 | --- | --- |
| LASACO | LASACO ASSURANCE | -4.80 | 49.05 | -0.06 |
| CAVERTON | CAVERTON OFFSHORE | -11.11 | 49.99 | -0.21 |
Highlighted Insight:
NCR (NIGERIA) PLC. is not only the top daily gainer but also the #1 YTD gainer (+721.8% YTD), with an exceptionally overbought RSI of 99.07—a textbook momentum surge but prudent traders should watch for exhaustion.
CAVERTON, appearing in today’s top losers and as a YTD gainer, signals volatility and a sharp sentiment shift. The RSI is just below 50, neither overbought nor oversold, but a double-digit price slide and bearish momentum raise caution flags.
Contrarian Signals
- NCR: RSI of 99.1 (extreme overbought) but up +721.8% YTD and daily MACD strongly bullish—momentum chasing could be risky here; tight stops advised.
- UNIONDICON: RSI 39.7 (neutral/borderline oversold), annual performance -12.5% YTD with another -10% today, but no technical bounce yet—potential value trap unless reversal signs appear.
- CAVERTON: Near-neutral RSI after steep drop suggests possible short-term relief, but series of negative technicals could prolong weakness.
- SUNUASSUR: Negative price action but RSI not yet oversold; still more room for downside.
Sector Heatmaps (Performance color-coded)
| Sector | Top Performer | Chg (%) | Bullish | Bearish | Institutional Activity |
|---|---|---|---|---|---|
| Banking | GTCO | +1.40 | GTCO, FIRSTHOLDCO | --- | Heavy (GTCO, ZENITHBANK, UBA, ACCESSCORP) |
| Insurance | PRESTIGE | +9.56 | PRESTIGE | LASACO | NEM (Unusual Vol) |
| Other Financials | STANBIC | 0.00 | CWG | CAVERTON | ACCESSCORP, STANBIC |
| Media/Entertainment | DAARCOMM | +8.08 | DAARCOMM | --- | --- |
| Real Estate | --- | --- | --- | UPDC | --- |
Dividend-Beta Matrix
| Stock | Div. Yield (%) | Beta | Technical Signal |
|---|---|---|---|
| ZENITHBANK | 2.25 | 1.20 | High Institutional Ownership (Bullish long-term) |
| PRESTIGE | 2.50 | -0.17 | Bullish 15DMA |
| ROYAL EXCHANGE | 7.81 | 0.96 | Bullish 15DMA |
| LASACO | 4.05 | 0.71 | Bearish 15DMA |
| UPDC | 34.25 | 1.10 | Bearish 15DMA |
- Defensive Opportunity: PRESTIGE combines a high dividend yield with low beta and bullish crossover—potential safe haven with upside.
- ROYAL EXCHANGE: Juicy yield, mid-range beta, technical strength.
- LASACO: Defensive on yield but faced with bearish 15DMA signal, making for a "wait and see” defensive pick.
Institutional Clustering Alerts
- ZENITHBANK: Commanding institutional trade value share (20.17% of all institutional trade value), signifying smart money interest despite flat short-term performance.
- UBA, ACCESSCORP, GTCO: Remain hot on institutional radar, generating the majority of order flows—a trend to watch for breakout opportunities or accumulation phases.
- STANBIC: Volume surge may precede a headline move given institutional attention.
Year-to-Date (YTD) Top Movers Tables
| Stock | Price | Chg YTD (%) | DivYield | Beta | RSI |
|---|---|---|---|---|---|
| NCR | 41.10 | +721.82 | 0.00 | -0.14 | 99.07 |
| IKEJAHOTEL | 20.80 | +85.02 | 0.94 | 0.70 | 60.12 |
| NEWGOLD | 55100 | +97.58 | 0.00 | 0.23 | 50.02 |
| SECURE ELEC TECH | 0.80 | +11.59 | 15.87 | 0.68 | 44.45 |
| UNIONDICON | 7.00 | -12.50 | 6.25 | -0.01 | 39.74 |
Analysis & Insights
- Turnover Drop: The significant step-down in turnover (value) despite improving ASI hints at a cautious market, perhaps awaiting fresh catalysts or digesting recent outperformance. Watch for reversals if liquidity remains thin.
-
Volume Breakouts:
- FIRSTHOLDCO and NEM both saw volume spikes 4-16x their average—traditionally a precursor to continued momentum but also ripe for profit-taking volatility.
- DAARCOMM (bullish 15DMA) reinforces momentum in the Media space.
-
Bullish/Bearish Crossovers:
- PRESTIGE (insurance) and GTCO (banking) signal sector-wide bullishness especially with robust price performance and crossovers.
- CAVERTON and LASACO appear in both the Bearish table and as top losers, suggesting downward pressure has both technical and fundamental backing.
-
YTD Outperformers & RSI:
- NCR is exceptionally overbought and momentum-led. History suggests caution at these RSI levels.
- SIAML ETF40 struggles YTD but technically in overbought territory; potential rebalancing candidate.
- Stocks with Both High Yield & Technical Momentum: ROYAL EXCHANGE and PRESTIGE: Great for risk-averse, yield-seeking investors who still want upside.
Retail vs. Institutional Activity & Patterns
- Trade Counts: Retail accounted for 66.98% of deals—but only 7.84% of value, showing institutions dominate volume and value.
- Institutions: Focused on banking (GTCO, Zenith, UBA, ACCESSCORP)—core blue chips—mirrored in bullish momentum stocks like GTCO and FIRSTHOLDCO.
- Retail: Trades are more spread, but also cluster around MTNN, ACCESSCORP, UBA, ZENITHBANK and GTCO—the same institutional names, hinting at consensus-driven flows which can exaggerate short-term trends.
- Patterns: Stocks with both high institutional and unusual volume activity (FIRSTHOLDCO, GTCO) tend to set the tone for the market’s near-term direction.
Top 5 Most Traded Stocks by Retail: MTNN, ACCESSCORP, UBA, ZENITHBANK, GTCO
Trader Suggestions & Potential Opportunities
- Momentum Chasers: Keep tight stops on NCR, EUNISELL, and IKEJA HOTEL—momentum is strong but at overbought extremes.
- Value Seekers: Watch UNIONDICON and CAVERTON for signs of technical reversal; volume stability needed first.
- Yield + Safety: PRESTIGE and ROYALEX combine yield and technical signals for low-beta portfolios.
- Risk: Beware of thin-liquidity rallies in low float names, volume spikes could precede reversals rather than continuations.
- Sector Rotation: Insurance and select banks are currently favored by technicals and flows.
- Divergences: Stocks like LASACO (yield, but bearish), deserve caution—don’t jump for yield alone.
Hidden/Noteworthy Insights
- Institutional clustering in core large banks is not just about size—it likely signals ongoing confidence in Nigerian financial sector resilience long-term.
- Stocks with unusual volume tend to presage sharp price moves, but need confirmation; FIRSTHOLDCO and NEM both warrant close monitoring tomorrow.
- Bullish momentum stocks with high RSI (>70): NCR (99.1), EUNISELL (78.5)—strong for traders but late for investors.
- Watch for sector laggards in high-yield names catching up if market rotation continues.
- Rising breadth and strong YTD suggest a secular bull, but drop in turnover signals caution for near term until fresh conviction emerges.
|
Top ASI Gainers Over Last 5 Trading Days
|
Top ASI Losers Over Last 5 Trading Days
|
For more detailed analysis, on InfoWARE Market Data Terminal <NSEPERF> <GO>
On InfoWARE Finance Mobile App (Android, iPhone & iPad, Windows Phone and Windows 8/10), "Top Gainers & Losers"
NCR (NIGERIA) PLC. (NCR) topped the advancers list closing at N45.20 with a gain of 9.98% followed by IKEJA HOTEL PLC (Ikejahotel) which closed at N22.85 with a gain of 9.86%.
On the flip side CAVERTON OFFSHORE SUPPORT GRP PLC (CAVERTON) and UNION DICON SALT PLC. (UNIONDICON) topped the decliners log with a loss of -10.00% at a close of N4.95, and -10.00% to close the day at N6.30 respectively.
| Symbol | LClose | %Chg |
|---|---|---|
| NCR | 45.20 | 9.98 |
| Ikejahotel | 22.85 | 9.86 |
| PRESTIGE | 1.49 | 9.56 |
| EUNISELL | 86.50 | 9.49 |
| STERLINGNG | 7.30 | 8.96 |
| Symbol | LClose | %Chg |
|---|---|---|
| CAVERTON | 4.95 | -10.00 |
| UNIONDICON | 6.30 | -10.00 |
| SUNUASSUR | 4.38 | -4.78 |
| LASACO | 2.50 | -4.58 |
| MANSARD | 12.45 | -4.23 |
For more detailed analysis,
- On InfoWARE Market Data Terminal <TOPG> <GO>
- On InfoWARE Finance Mobile App ( Android, iPhone & iPad and Windows 10) , "Top Gainers & Losers"
Currency Market
In the currency market, the Naira was unchanged against the dollar at 1 to 1NSE: Bull Signal - Price crossed above 15 Day MA
This signal implies these stocks are under buying pressure and the price might continue to rise and therefore positions should be monitored closely. Further suggested analysis include looking at the overall market (ASI) to see if the uptrend is market wide, sector wide or specific to the stock. Portfolio managers tend to use this as a signal to do more research to add to their positions or lock in some profits. Typically further analysis should be done using commands like PC and RV on the InfoWARE Market Data Terminal. Another command is ALERTS to set price triggers for possible exit or entry as necessary
For more detailed analysis,
- On InfoWARE Market Data Terminal <NSEPERF> <GO>
- On InfoWARE Finance Mobile App ( Android , iPhone & iPad and Windows 10) , "Top Gainers & Losers"
| Symbol | Price | %Chg | 15DMA | PE | EPS | DivY | MktCap | Vol | Trades | Value | LstTradeTime |
|---|---|---|---|---|---|---|---|---|---|---|---|
| FG152028S1 | 99.00 | 69.70 | 93.53 | 0.00 | 94.64B | 950.00 | 1.00 | 940.50K | 25-Nov-2025 14:30:51.190 | ||
| PRESTIGE | 1.49 | 8.72 | 1.42 | 10.49 | 0.08 | 2.50 | 19.75B | 1.20M | 63.00 | 1.78M | 25-Nov-2025 14:30:22.010 |
| DAARCOMM | 0.99 | 8.08 | 0.93 | 0.00 | 0.00 | 0.00 | 11.88B | 12.64M | 90.00 | 11.14M | 25-Nov-2025 14:30:17.713 |
| ROYALEX | 1.99 | 7.54 | 1.92 | 0.00 | 0.00 | 7.81 | 10.24B | 1.82M | 53.00 | 3.56M | 25-Nov-2025 14:30:22.193 |
| MERGROWTH | 430.00 | 6.98 | 417.20 | 0.00 | 0.00 | 255.00 | 4.00 | 102.09K | 25-Nov-2025 14:32:30.133 | ||
| NAHCO | 106.50 | 6.90 | 104.12 | 92.98 | 0.41 | 6.66 | 207.58B | 761.62K | 158.00 | 76.80M | 25-Nov-2025 14:30:20.453 |
| VETINDETF | 60.00 | 6.67 | 58.36 | 0.00 | 0.00 | 3.55K | 8.00 | 198.88K | 25-Nov-2025 14:32:30.253 | ||
| CWG | 17.00 | 4.71 | 16.32 | 0.00 | 0.00 | 2.46 | 42.92B | 4.23M | 148.00 | 72.02M | 25-Nov-2025 14:30:17.693 |
| NEWGOLD | 57,500.00 | 4.17 | 55,889.47 | 0.00 | 0.00 | 0.00 | 0.00 | 51.00 | 14.00 | 2.91M | 25-Nov-2025 14:32:30.163 |
| NGXSOVBND | 671.67 | 3.83 | 667.80 | 0.00 | 0.00 | 0.00 | 0.00 | 950.00 | 1.00 | 940.50K | 25-Nov-2025 14:31:38.470 |
| FIRSTHOLDCO | 31.00 | 1.45 | 30.80 | 0.00 | 0.00 | 93.72M | 372.00 | 2.91B | 25-Nov-2025 14:32:30.540 | ||
| GTCO | 86.00 | 1.40 | 84.96 | 7.49 | 7.10 | 1.88 | 2,531.08B | 26.19M | 876.00 | 2.23B | 25-Nov-2025 14:30:18.870 |
NSE: BEAR Signal - Price crossed below 15 Day MA
This signal implies these stocks are under selling pressure and the price might continue to slide and therefore positions should be monitored closely. Further suggested analysis include looking at the overall market (ASI) to see if the downtrend is market wide, sector wide or specific to the stock. If the overal market trend is upwards, then since these stocks are heading in the opposite direction, then further analysis should be done using commands like PC and RV on the InfoWARE Market Data Terminal. Another command is ALERTS to set price triggers for possible exit is necessar
For more detailed analysis,
- On InfoWARE Market Data Terminal <BEARM> <GO>
- On InfoWARE Finance Mobile App ( Android , iPhone & iPad and Windows 10)
| Symbol | Price | %Chg | 15DMA | PE | EPS | DivY | MktCap | Vol | Trades | Value | LstTradeTime |
|---|---|---|---|---|---|---|---|---|---|---|---|
| UPDC | 6.00 | 0.00 | 6.01 | 0.00 | 0.00 | 34.25 | 111.36B | 881.75K | 92.00 | 5.03M | 25-Nov-2025 14:30:23.663 |
| VFDGROUP | 10.40 | -1.92 | 10.49 | 0.00 | 0.00 | 0.00 | 0.00 | 1.63M | 90.00 | 16.95M | 25-Nov-2025 14:30:23.923 |
| LASACO | 2.50 | -4.80 | 2.51 | 21.56 | 0.11 | 4.05 | 4.58B | 8.13M | 42.00 | 20.27M | 25-Nov-2025 14:30:19.670 |
| CAVERTON | 4.95 | -11.11 | 5.03 | 1.15 | 1.57 | 5.52 | 16.59B | 2.86M | 80.00 | 14.48M | 25-Nov-2025 14:32:29.820 |
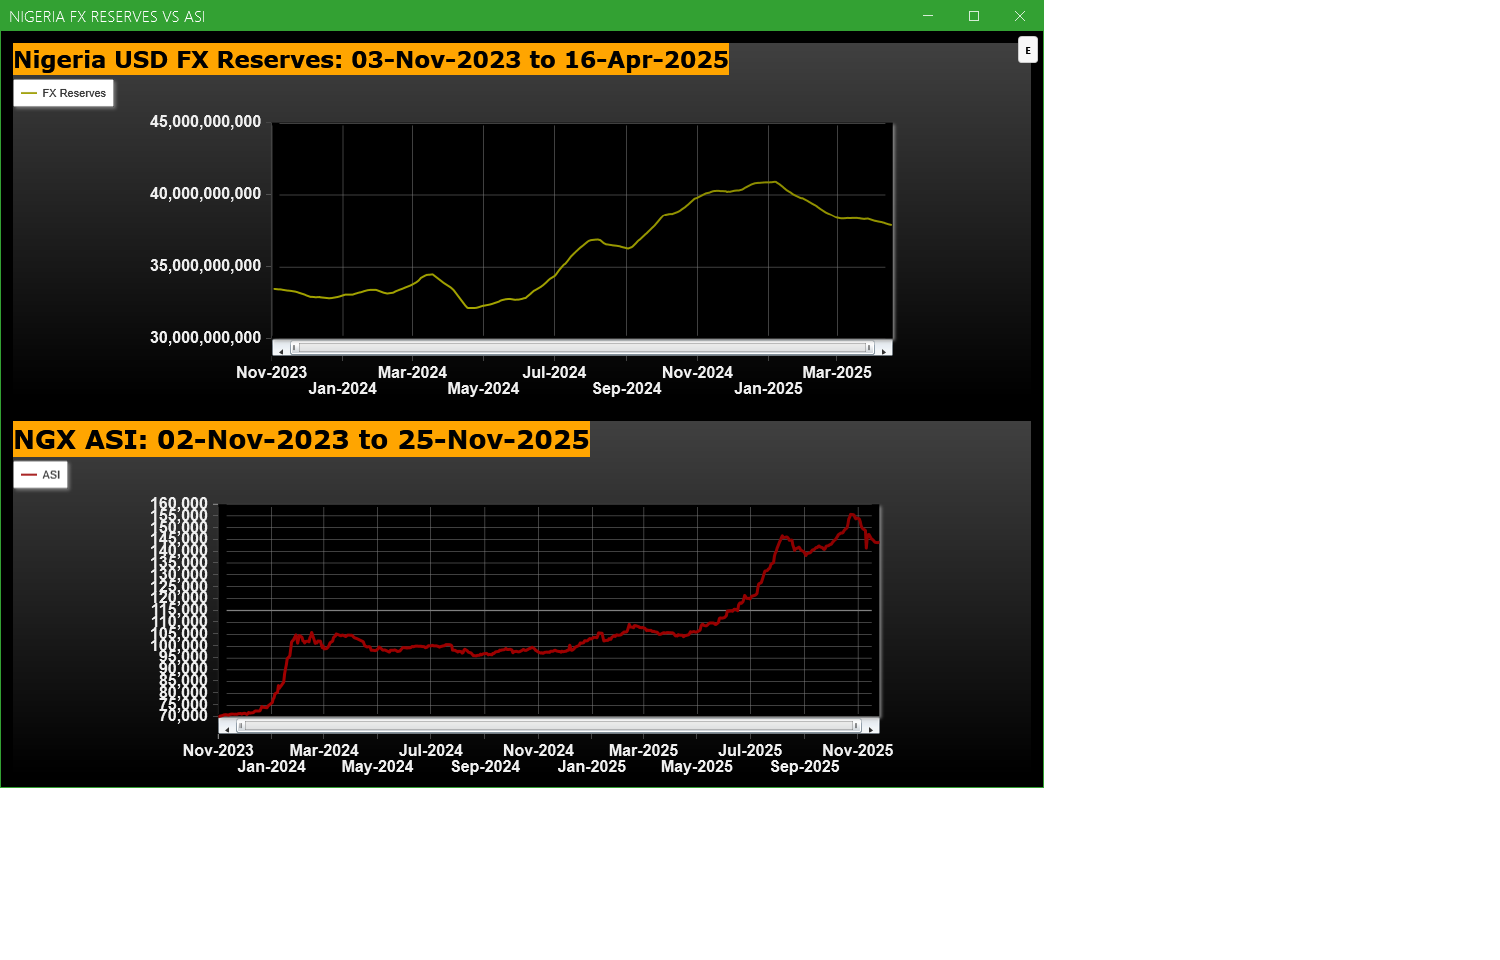
Economic Indicators - Nigeria FX Reserves Vs ASI Chart
Nigeria FX Reserves are assets held on reserve by CBN in foreign currencies. These reserves are used to back liabilities and influence monetary policy. Given the nature of the Nigeria economy, FX Reserves can appear to have an outsize influence on the economy and hence on the capital market. The chart below allows comparison of FX Reserves against the ASI to make investment decisions
For more detailed analysis,
- On InfoWARE Market Data Terminal <CI> <GO>
- On InfoWARE Finance Mobile App ( Android , iPhone & iPad and Windows 10) , "Research"
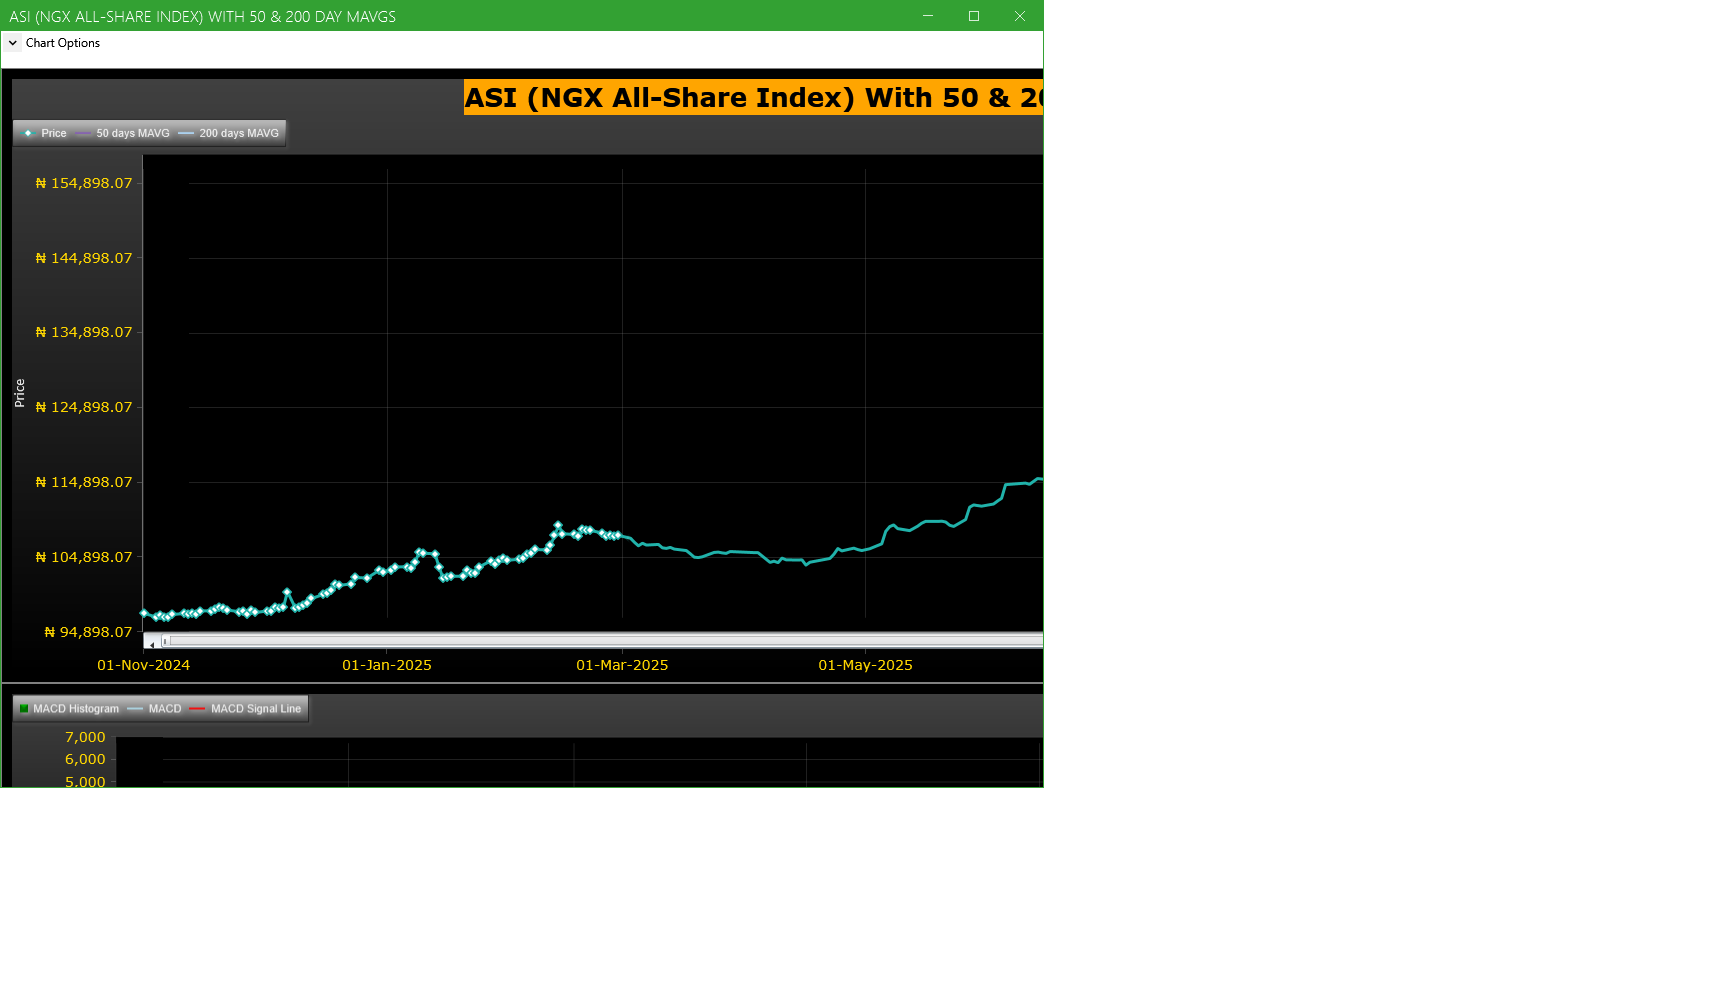
Market Trend - ASI (NGX All-Share-Index) With 50 & 200 Day MAvgs Chart
Technical traders typically use the 50 & 200 day moving averages to aid in choosing
where to enter or exit a position, which then causes these levels to act as strong
support or resistance. As a general guideline, if the price is above a moving average,
the trend is up. If the price is below a moving average, the trend is down.
It is important to note that critics of technical analysis say that moving averages act
as support and resistance because so many traders use these indicators to inform their
trading decisions. Also moving averages tend to work quite well in strong trending conditions
but poorly in choppy or ranging conditions.
Trading Strategies: Crossovers
Crossovers are one of the main moving average strategies. The first type is a price crossover,
which is when the price crosses above or below a moving average to signal a potential change
in trend. Another strategy is to apply two moving averages to a chart: one longer and one
shorter. When the shorter-term MA crosses above the longer-term MA, it is a buy signal, as
it indicates that the trend is shifting up. This is known as a golden cross. Meanwhile, when
the shorter-term MA crosses below the longer-term MA, it is a sell signal, as it indicates that
the trend is shifting down. This is known as a dead/death cross
For more detailed analysis,
- On InfoWARE Market Data Terminal <CI> <GO>
- On InfoWARE Finance Mobile App ( Android , iPhone & iPad and Windows 10) , "Research"
Unusual Volume: Volume traded is more than double the 90 day moving average (All exchanges; ASI & ASem). For more detailed analysis,
- On InfoWARE Market Data Terminal <UV> <GO>
- On InfoWARE Finance Mobile App ( Android , iPhone & iPad and Windows 10)
| Symbol | Name | Volume | 90DAvgVol | %VolChg | Price | LClose | %Chg | Trades | Value |
|---|---|---|---|---|---|---|---|---|---|
| FIRSTHOLDCO | FIRST HOLDCO PLC | 93.72M | 17.95M | 422.03 | 31.00 | 30.55 | 1.47 | 372 | 2.91B |
| STANBIC | STANBIC IBTC HOLDINGS PLC | 30.56M | 5.08M | 501.94 | 105.00 | 105.00 | 0.00 | 170 | 3.21B |
| NEM | N.E.M INSURANCE CO (NIG) PLC. | 13.93M | 825.44K | 1,587.20 | 25.45 | 26.00 | -2.12 | 213 | 341.33M |
| DAARCOMM | DAAR COMMUNICATIONS PLC | 12.64M | 3.23M | 291.62 | 0.99 | 0.91 | 8.79 | 90 | 11.14M |
| NGXGROUP | NIGERIAN EXCHANGE GROUP | 3.44M | 1.36M | 153.64 | 51.60 | 51.60 | 0.00 | 158 | 172.60M |
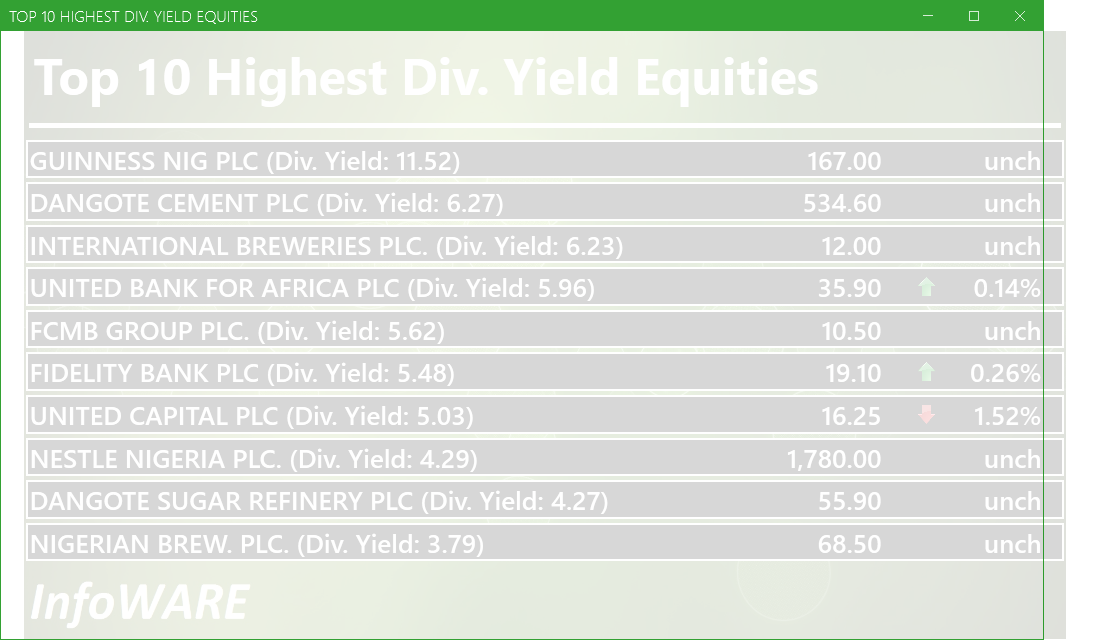
Investment Insights - High Div. Stocks
Dividend stocks distribute a portion of the company earnings to investors on a regular basis and they can a great choice for investors looking for regular income. As an investment or trading strategy, high dividend yield equities provide annual cash payments as against mostly capital gains in the price of a stock. The list in the table below represent the highest dividend paying stocks from the list of the most liquid stocks in the NSE top 30.
For more detailed analysis,
- On InfoWARE Market Data Terminal <HYIELD> <GO>
- On InfoWARE Finance Mobile App ( Android , iPhone & iPad and Windows 10) , "Research"
African Markets
| Name | LClose | Change | %Chg |
|---|---|---|---|
| BRVM Stock Exchange | 343.66 | -0.62 | -0.18 |
| Botswana Stock Exchange | 10,626.44 | -20.23 | -0.19 |
| Egyptian Exchange | 40,064.59 | -380.18 | -0.94 |
| Ghana Stock Exchange | 8,558.60 | 37.49 | 0.44 |
| Johannesburg Stock Exchange | 110,015.40 | 372.78 | 0.34 |
| Lusaka Stock Exchange | 25,384.06 | 146.38 | 0.58 |
| Casablanca Stock Exchange | 18,337.56 | 132.89 | 0.73 |
| Malawi Stock Exchange | 624,740.79 | -10,933.60 | -1.72 |
| Nigeria Stock Exchange | 143,614.61 | -114.98 | -0.08 |
| Nairobi Securities Exchange | 186.12 | -1.79 | -0.95 |
| Namibian Stock Exchange | 1,964.58 | 2.55 | 0.13 |
| Rwanda Stock Exchange | 179.20 | 0.00 | 0.00 |
| Tunis Stock Exchange | 13,231.09 | -30.50 | -0.23 |
| Uganda Securities Exchange | 1,585.37 | 0.63 | 0.04 |
Nigeria Market Indexes
| Symbol | LClose | %Chg | WTD% | MTD% | QTD% | YTD% | MktCap | Trades |
|---|---|---|---|---|---|---|---|---|
| ASI | 143,763.13 | 0.10 | 0.10 | -6.49 | 0.55 | 39.33 | 18,295 | |
| NGX30 | 5,258.72 | 0.02 | 0.02 | -6.73 | 0.78 | 37.85 | 10,223 | |
| NGXAFRBVI | 3,083.06 | 0.52 | 0.52 | -7.09 | -13.14 | 24.28 | 4,121 | |
| NGXAFRHDYI | 20,458.38 | -0.04 | -0.04 | -6.14 | -8.10 | 20.15 | 4,546 | |
| NGXASEM | 1,392.88 | 0.00 | 0.00 | 0.00 | -9.44 | -12.05 | 3 | |
| NGXBNK | 1,374.07 | 0.38 | 0.38 | -6.09 | -9.41 | 26.36 | 4,422 | |
| NGXCG | 3,820.20 | 0.32 | 0.32 | -6.54 | -5.69 | 35.03 | 9,735 | |
| NGXCNSMRGDS | 3,444.86 | 0.01 | 0.01 | -3.01 | 1.83 | 98.62 | 2,101 | |
| NGXCOMMDTY | 1,182.74 | 0.00 | 0.00 | -2.07 | 5.43 | 18.27 | ||
| NGXGROWTH | 14,063.68 | -0.04 | -0.04 | -9.31 | -6.69 | 81.17 | 274 | |
| NGXINDUSTR | 5,234.06 | 0.00 | 0.00 | -12.12 | 3.28 | 46.55 | 1,352 | |
| NGXINS | 1,065.77 | -0.84 | -0.84 | -12.14 | -10.90 | 35.56 | 1,303 | |
| NGXLOTUSISLM | 12,776.15 | 0.32 | 0.32 | -6.14 | 7.62 | 83.36 | 3,347 | |
| NGXMAINBOARD | 7,048.78 | 0.11 | 0.11 | -3.82 | 0.06 | 40.86 | 12,789 | |
| NGXMERIGRW | 9,884.42 | -0.33 | -0.33 | -4.22 | -0.19 | 51.53 | 2,786 | |
| NGXMERIVAL | 12,200.16 | 0.22 | 0.22 | -6.37 | -8.74 | 16.97 | 5,239 | |
| NGXOILGAS | 2,700.88 | -0.17 | -0.17 | -3.47 | 6.92 | -0.38 | 271 | |
| NGXPENBRD | 2,696.56 | 0.12 | 0.12 | -6.09 | 1.71 | 47.22 | 15,039 | |
| NGXPENSION | 6,596.63 | 0.33 | 0.33 | -5.14 | -2.10 | 45.49 | 11,345 | |
| NGXPREMIUM | 14,002.96 | 0.08 | 0.08 | -10.86 | 2.27 | 43.87 | 5,232 | |
| NGXSOVBND | 671.67 | 3.98 | 3.98 | 0.49 | 2.19 | 11.66 | 1 |
For more detailed analysis,
- On InfoWARE Market Data Terminal <MKTINS> <GO>
- On InfoWARE Finance Mobile App ( Android, iPhone & iPad and Windows 10) , "Market Indexes"
Find the topic interesting? Will like to comment? Contact Us at solutions@infowarelimited.com
Top News

Chart Of The Day - ASI Chart Vs ASI Advance Decline Line (YTD) (25-Nov-2025 15:06:38.995)
InfoWARE AI Analyst Daily Market Report: 25-Nov-2025

[VETGOODS]>> DAILY INDICATIVE PRICES
[XNSA]>> H2 2025 BC/DR TEST
[XNSA]>> AELP CAPACITY BUILDING & ASSDA FORUM
[XNSA]>> RESIGNATION OF A DIRECTOR (TRANSWORLD INVESTMENT AND SECURITIES LIMITED
[STANBICETF30]>> DAILY INDICATIVE PRICES
[XNSA]>> CORDROS MILESTONE FUNDS' BID & OFFER PRICES
[XNSA]>>GO-LIVE NOTIFICATION: TRANSITION TO T+2 SETTLEMENT CYCLE
Chart Of The Day - ASI Chart Vs ASI Advance Decline Line (YTD) (24-Nov-2025 15:11:54.845)
InfoWARE AI Analyst Daily Market Report: 24-Nov-2025
[XNSA]>> CORDROS MILESTONE FUNDS' BID & OFFER PRICES
[VSPBONDETF]>> DAILY INDICATIVE PRICES
[VSPBONDETF]>> DAILY INDICATIVE PRICES
[XNSA]>> EMERGING AFRICA DAILY MUTUAL FUND PRICES
[XNSA]>> H2 2025 BC/DR TEST
[XNSA]>> LISTING OF 2025, Q3 SCRIP UNIT OF 243,424 UNITS OF NIDF
[XNSA]>> AELP CAPACITY BUILDING & ASSDA FORUM
[XNSA]>>GO-LIVE NOTIFICATION: TRANSITION TO T+2 SETTLEMENT CYCLE
InfoWARE AI Analyst Weekly Market Report: 21-Nov-2025
Chart Of The Day - ASI Chart Vs ASI Advance Decline Line (YTD) (21-Nov-2025 15:07:14.650)
InfoWARE AI Analyst Daily Market Report: 21-Nov-2025
[VETINDETF]>> DAILY INDICATIVE PRICES
[XNSA]>> NORRENBERGER MUTUAL FUNDS WEEKLY UPDATE TO NGX
[XNSA]>> H2 2025 BC/DR TEST
[XNSA]>> CORDROS MILESTONE FUNDS' BID & OFFER PRICES
[XNSA]>> NGX FIXED INCOME INDICATIVE PRICE LIST FOR NOV 21, 2025
[STANBICETF30]>> DAILY INDICATIVE PRICES
[XNSA]>> AELP CAPACITY BUILDING & ASSDA FORUM
[XNSA]>>GO-LIVE NOTIFICATION: TRANSITION TO T+2 SETTLEMENT CYCLE
Get IDIA - the stock trading app for the modern investor
Solutions by Business
Product Suites
Company
Contacts
- 8th Floor,
- South Atlantic Petroleum Towers,
- 1 Adeola Odeku Street,
- Victoria Island,
- Lagos, Nigeria.
- Email: solutions@infowarelimited.com
Follow Us
 |
 |
 |
 |