


InfoWARE AI Analyst Daily Market Report: 27-Nov-2025 | InfoWARE Finance
Get IDIA - the stock trading app for the modern investor


InfoWARE AI Analyst Daily Market Report: 27-Nov-2025
(Source: InfoWARE Terminal, Date: 27-Nov-2025)
Dear Investor,
NGX Daily Market Summary – Thursday, November 27, 2025
The NGX All Share Index edged up 0.12% to close at 143,064.57, extending its strong 38.82% YTD run. Today's session, however, was marked by a substantial -66.54% drop in market turnover to ₦11.07B, alongside a sharply lower trading volume of 300.37M (from 669.06M yesterday), indicating some caution—or perhaps exhaustion—among market participants. Despite lighter activity, advancers outpaced decliners at 1.5x breadth, boosted by outsized moves in several mid- and small-cap names. Top gainer Ikeja Hotel closed limit-up, just as Linkage Assurance sold off hard. Large volume spikes in both gainers and select other stocks suggest churning beneath the calm index surface, with technical breakouts and breakdowns apparent in both bullish and bearish corners.
Key Market Breadth & Trends
- Market Breadth: 36 advancers vs 24 decliners (breadth ratio: 1.50x). Bullish skew suggests underlying optimism, though fewer rising volumes (51 up, 91 down) hint at weakening momentum below the surface.
- Turnover Caution: Trading value plunged 66.54% from yesterday to ₦11.07B—possible evidence of "risk-off," profit-taking, or waiting for catalysts.
- Volume Divergence: Despite price advances, only about one-third of stocks saw rising volumes, hinting at fewer high-conviction buys and possible thin liquidity on up-moves.
- Naira Watch: The Naira slid -0.02% to 1,455/$—minimal, but part of a worrisome longer FX trend.
Top 5 Gainers
| Stock | % Change | Price (₦) | RSI | MACD | 15D/50D Crossover |
|---|---|---|---|---|---|
| IKEJA HOTEL PLC | +10.00% | 27.50 | 74.5 (overbought) | 0.85 | 20.26 > 19.86 |
| LINKAGE ASSURANCE | +10.00% | 1.87 | 43.7 | -0.06 | 1.76 > 1.94 (No) |
| LEARN AFRICA | +9.96% | 5.74 | 20.4 (oversold bounce) | -0.21 | 5.79 > 6.34 (No) |
| NCR (NIGERIA) | +9.96% | 54.65 | 99.4 (extremely overbought) | 7.47 | 32.83 > 20.98 |
| UNION DICON SALT | +9.52% | 6.90 | 31.4 | -0.45 | 7.00 > 7.96 (No) |
- IKEJA HOTEL: Limit-up move, 518% volume spike vs 90D average. RSI at 74.5 (overbought), bullish MACD. Caution: hot momentum, but potentially due for pullback.
- NCR: RSI at 99.4—extremely stretched. Insane 893.6% YTD run; continued technical breakout with momentum, but watch for exhaustion soon.
- LEARN AFRICA: Oversold RSI (20.4); today's pop likely relief bounce, not yet a trend reversal.
Top 5 Losers
| Stock | % Change | Price (₦) | RSI | MACD | 15D/50D Crossover |
|---|---|---|---|---|---|
| CHAMPION BREW | -9.85% | 12.35 | 44.2 | -0.51 | 13.68 < 15.06 (Bearish) |
| VETIVA GRIFFIN 30 ETF | -9.22% | 58.10 | 65.8 | 2.55 | 58.84 < 55.26 (Still above) |
| STERLING FIN HOLDINGS | -8.33% | 7.15 | 54.0 | -0.09 | 7.38 > 7.65 (Bearish cross) |
| VETIVA INDUSTRIAL ETF | -8.33% | 55.00 | 55.3 | 1.39 | 58.07 > 54.18 (Approaching) |
| UPDC PLC | -8.23% | 5.02 | 40.4 | -0.16 | 5.87 > 6.29 (Bearish) |
- CHAMPION: RSI 44.2 with negative MACD. Despite a negative YTD (-9.85%), RSI neither oversold nor at risk. Weak technicals.
- VETGRIF30: Hefty drop puts it near YTD lows; technicals show potential further downside even at high RSI (65.8).
- UPDC: Continues its YTD decline, breaking key moving averages—the pain isn't over.
Bullish & Bearish Technical Patterns
-
Bullish Momentum Watch:
- IKEJA HOTEL—RSI 74.5, bullish MACD, price above 15D & 50D MAs, +10% move, strong volume surge: Strong uptrend, but overbought—pullback likely before next leg up.
- NCR—RSI 99.4 (!), huge 893% YTD, technicals all green: Caution for reversal risk at these levels.
-
Bearish Momentum:
- STERLINGNG, VETGRIF30, UPDC PLC—below 15DMA, negative MACD, plus poor YTD or multi-day returns: Watch for further selling pressure.
- Notable Overlaps: IKEJAHOTEL appears as both unusual volume and top gainer; VETGRIF30, STERLINGNG, UPDC in both top losers, YTD losers, and bearish technicals—implies strong negative conviction.
Contrarian Signals
- CHAMPION BREW: RSI at 44.2 (neutral), bearish MACD, and -9.85% YTD but not yet oversold—may attract value hunters soon if selling persists.
- LEARN AFRICA: RSI at 20.4 (deeply oversold), but up +9.96% today—a snap-back rally, but unless buying is sustained could quickly reverse.
- VETGRIF30 ETF: RSI above 65 despite multi-session sharp losses; high volatility implies potential for a violent short-covering bounce.
- MTNN: Crossing above 15DMA with moderate gains yet mixed RSI/action—still among most-traded for both retail and institutional, but watch for leadership role under threat if index weakens.
Sector Heatmaps
| Sector | Advancers | Decliners | Notable Technicals | Inst. Activity |
|---|---|---|---|---|
| Insurance | LINKASSURE, VERITASKAP, SOVRENINS | ROYAL EXCH | Bullish cross above 15DMA for LINKASSURE/VERITASKAP | Low |
| Banking | ZENITHBANK, STERLINGNG | Both in Top Inst. & Retail Activity; Bearish MA cross | High (ZENITHBANK, UBA) | |
| Hotels/Lodging | IKEJAHOTEL | Extremely high momentum, high vol. | Low | |
| Telecoms | MTNN | Bullish crossover, moderate RSI, mixed flows | High | |
| Other Financials | ACCESSCORP | Bearish MA crossover, heavy volume | Moderate | |
| ETF | VETGRIF30, VETINDETF, VETBANK, MERVALUE | Bearish signals dominate | Low |
Comments: Banks are seeing heavy profit-taking; Insurance counter is showing risk-on flows; lodging/hotels in momentum "blowoff" territory; ETFs losing broadly, often leading in previous months.
Dividend–Beta Matrix (Defensive Opportunity Spotting)
| Stock | Div Yield (%) | Beta | Current Trend |
|---|---|---|---|
| LINKASSURE | 5.56 | 0.41 (Low Risk) | Bullish MA crossover, but watch for reversal after pop |
| ZENITHBANK | 2.25 | 1.20 (High Volatility) | Bearish MA cross, high institutional activity |
| SOVRENINS | 3.75 | 1.12 | Bullish |
| ROYAL EXCHANGE | 7.81 | 0.96 | Bearish |
| MTNN | 3.29 | 1.31 | Bullish crossover, but trendless recently |
| ACCESSCORP | 1.87 | 1.42 | Bearish, under distribution |
- LINKASSURE offers a 5.56% yield with low beta—potential defensive play, but technicals suggest caution after sharp jump.
- High-yield insurance stocks increasingly attract yield-seeking, risk-averse investors.
Institutional Clustering Alerts
- ZENITHBANK: Accounted for 20.17% of institutional gross trade value, topping both institutional & retail trade count leaderboards. Despite this, price -0.50%; institutionals may be distributing (selling), or block trades distorting signals.
- UBA, MTNN, GTCO, ACCESSCORP also absorbed heavy institutional flows with mixed-to-negative price action—potential caution signal for sector or broad market.
Trading Activity Insights
| Investor Type | Trade Count | Total Volume | Total Trade Value | % Trade Count | % Volume | % Value |
|---|---|---|---|---|---|---|
| Institutional | 1,742 | 206.2M | ₦10.65B | 33.5 | 63.7 | 88.0 |
| Retail | 16,703 | 117.4M | ₦1.45B | 66.5 | 36.3 | 12.0 |
- Institutions delivered the lion’s share of value (88%) and volume (64%) despite just 33.5% of trade count—i.e., average institutional trade size is substantially larger.
- Retail trades dominate number of deals, but not impact; smaller, dabbling orders.
- Patterns: Both retail and institutional favored ZENITHBANK, ACCESSCORP, MTNN, GTCO, UBA. These stocks are now highly liquid, but also prone to institutional-driven swings; traders should track block activity and be wary of "herd moves".
- On days like today, institutional clustering in banking stocks can signal sector legs up or prepare for short-term distribution; volumes falling but activity high suggests smart money positioning.
Top 5 Institutional Most Traded
- ZENITHBANK: -0.50% (large trade, price down—distribution?)
- UBA: +0.28%
- MTNN: +1.06%
- GTCO: +0.12%
- ACCESSCORP: +0.96%
Top 5 Retail Most Traded
- ZENITHBANK
- ACCESSCORP
- MTNN
- GTCO
- UBA
YTD Top Gainers & Losers: Technical & Sentiment Trends
| YTD Gainer | YTD (%) | 5-Day (%) | 1-Day (%) | RSI | Latest |
|---|---|---|---|---|---|
| NCR (NIGERIA) | 893.6 | 32.97 | 9.96 | 99.4* | Technical exhaustion imminent; high caution |
| IKEJA HOTEL | 122.7 | 32.21 | 10.00 | 74.5 | Overbought, but momentum intact |
| VERITAS KAP | 24.2 | 12.12 | 8.82 | 41.3 | Still has room for upside before overbought |
| AIICO | 124.2 | 10.00 | 0.00 | 49.6 | Neutral momentum |
| YTD Loser | YTD (%) | 5-Day (%) | 1-Day (%) | RSI | Latest |
|---|---|---|---|---|---|
| UPDC PLC | -27.1 | -16.33 | -8.23 | 40.4 | Under distribution, little support below |
| VETGRIF30 | -53.9 | -9.22 | -9.22 | 65.8 | Weak bounce attempts; watch for reversal trap |
| MEYER PLC | -13.1 | -9.91 | 0.00 | 18.6 | Extremely oversold, technical bounce possible |
- Gainers (NCR, IkejaHotel): RSI flagged as extremely overbought; short-term correction likely, but sustainable multi-month trend in doubt unless backed by new fundamentals.
- Losers (UPDC, VETGRIF, MEYER): Persistent sell-offs, some nearing oversold—potential for relief rallies, but trend is still your friend on the downside.
- LEARN AFRICA, MEYER, CHAMPION: Technical bounces from extreme pessimism. Swing-trading potential.
Key Opportunities & Cautions
- Trade Opportunity: VERITASKAP and LINKASSURE showing strong bullish technicals and high dividend yields with relatively low betas—suitable for medium-term accumulation or tactical yield hunting.
- Caution: IKEJA HOTEL and NCR (NIGERIA)—volatile, overbought, crowded momentum; consider scaling out or stop-loss discipline if long.
- Banking Sector: Under significant institutional churn. Banks (ZENITHBANK, GTCO, UBA) see heavy two-way flows but lack price upside, suggesting smart money hesitancy or sector rotation.
- Bearish Momentum: UPDC, VETGRIF30, STERLINGNG are short candidates or avoids until clear evidence of a bottom emerges.
- ETF Weakness: Persistent losses in VETGRIF30/VETINDETF confirm waning risk appetite in broad NGX-linked baskets.
Suggestions for Traders
- Momentum chasers: Be wary of "crowded trades" like NCR/IkejaHotel—extremely high RSI is a sell signal for swing traders.
- Defensive seekers: LINKASSURE, SOVRENINS—strong yield, low beta, technical cross up—pick on minor pullbacks.
- Bargain hunters: Keep watch for volume reversals in deep YTD losers like CHAMPION, MEYER, UPDC.
- Institutional shadowing: Track block trades in big banks; mean reversion likely after profit-taking flush is done.
- ETF-focused strategies: Avoid fresh longs for now; monitor for bottoming patterns.
|
Top ASI Gainers Over Last 5 Trading Days
|
Top ASI Losers Over Last 5 Trading Days
|
For more detailed analysis, on InfoWARE Market Data Terminal <NSEPERF> <GO>
On InfoWARE Finance Mobile App (Android, iPhone & iPad, Windows Phone and Windows 8/10), "Top Gainers & Losers"
IKEJA HOTEL PLC (Ikejahotel) topped the advancers list closing at N27.50 with a gain of 10.00% followed by LINKAGE ASSURANCE PLC (LINKASSURE) which closed at N1.87 with a gain of 10.00%.
On the flip side CHAMPION BREW. PLC. (CHAMPION) and VETIVA GRIFFIN 30 ETF (VETGRIF30) topped the decliners log with a loss of -9.85% at a close of N12.35, and -9.22% to close the day at N58.10 respectively.
| Symbol | LClose | %Chg |
|---|---|---|
| Ikejahotel | 27.50 | 10.00 |
| LINKASSURE | 1.87 | 10.00 |
| LEARNAFRCA | 5.74 | 9.96 |
| NCR | 54.65 | 9.96 |
| UNIONDICON | 6.90 | 9.52 |
| Symbol | LClose | %Chg |
|---|---|---|
| CHAMPION | 12.35 | -9.85 |
| VETGRIF30 | 58.10 | -9.22 |
| VETINDETF | 55.00 | -8.33 |
| STERLINGNG | 7.15 | -8.33 |
| UPDC | 5.02 | -8.23 |
For more detailed analysis,
- On InfoWARE Market Data Terminal <TOPG> <GO>
- On InfoWARE Finance Mobile App ( Android, iPhone & iPad and Windows 10) , "Top Gainers & Losers"
Currency Market
In the currency market, the Naira fell 0.02%(-0.25) against the Dollar to settle at 1 to 1NSE: Bull Signal - Price crossed above 15 Day MA
This signal implies these stocks are under buying pressure and the price might continue to rise and therefore positions should be monitored closely. Further suggested analysis include looking at the overall market (ASI) to see if the uptrend is market wide, sector wide or specific to the stock. Portfolio managers tend to use this as a signal to do more research to add to their positions or lock in some profits. Typically further analysis should be done using commands like PC and RV on the InfoWARE Market Data Terminal. Another command is ALERTS to set price triggers for possible exit or entry as necessary
For more detailed analysis,
- On InfoWARE Market Data Terminal <NSEPERF> <GO>
- On InfoWARE Finance Mobile App ( Android , iPhone & iPad and Windows 10) , "Top Gainers & Losers"
| Symbol | Price | %Chg | 15DMA | PE | EPS | DivY | MktCap | Vol | Trades | Value | LstTradeTime |
|---|---|---|---|---|---|---|---|---|---|---|---|
| LINKASSURE | 1.87 | 9.09 | 1.76 | 59.89 | 0.02 | 5.56 | 26.18B | 2.61M | 62.00 | 4.85M | 27-Nov-2025 14:30:15.403 |
| VERITASKAP | 1.85 | 8.11 | 1.75 | 48.77 | 0.02 | 4.17 | 25.65B | 4.37M | 90.00 | 7.45M | 27-Nov-2025 14:30:17.257 |
| UCAP | 17.20 | 4.36 | 17.17 | 19.15 | 0.93 | 5.03 | 103.20B | 2.90M | 186.00 | 49.42M | 27-Nov-2025 14:30:16.990 |
| FG202034S2 | 117.42 | 2.90 | 114.24 | 0.00 | 0.00 | 1.63K | 1.00 | 1.91M | 27-Nov-2025 14:30:20.660 | ||
| SOVRENINS | 2.97 | 2.36 | 2.95 | 27.95 | 0.03 | 3.75 | 33.75B | 1.28M | 75.00 | 3.54M | 27-Nov-2025 14:30:16.543 |
| FTNCOCOA | 5.00 | 2.00 | 4.93 | 0.00 | 0.00 | 1.60 | 19.50B | 810.92K | 65.00 | 4.01M | 27-Nov-2025 14:30:14.790 |
| MTNN | 470.00 | 1.06 | 468.82 | 16,715.80 | 0.01 | 3.29 | 9,566.62B | 3.46M | 900.00 | 1.63B | 27-Nov-2025 14:30:41.240 |
| NGXAFRHDYI | 20,692.99 | 0.76 | 20,632.75 | 7.46 | 39.30 | 0.00 | 0.00 | 90.99M | 4,437.00 | 5.23B | 27-Nov-2025 14:30:22.820 |
NSE: BEAR Signal - Price crossed below 15 Day MA
This signal implies these stocks are under selling pressure and the price might continue to slide and therefore positions should be monitored closely. Further suggested analysis include looking at the overall market (ASI) to see if the downtrend is market wide, sector wide or specific to the stock. If the overal market trend is upwards, then since these stocks are heading in the opposite direction, then further analysis should be done using commands like PC and RV on the InfoWARE Market Data Terminal. Another command is ALERTS to set price triggers for possible exit is necessar
For more detailed analysis,
- On InfoWARE Market Data Terminal <BEARM> <GO>
- On InfoWARE Finance Mobile App ( Android , iPhone & iPad and Windows 10)
| Symbol | Price | %Chg | 15DMA | PE | EPS | DivY | MktCap | Vol | Trades | Value | LstTradeTime |
|---|---|---|---|---|---|---|---|---|---|---|---|
| MERVALUE | 220.00 | -0.23 | 220.22 | 0.00 | 0.00 | 555.00 | 3.00 | 122.08K | 27-Nov-2025 14:30:40.887 | ||
| TANTALIZER | 2.29 | -0.44 | 2.30 | 0.00 | 0.00 | 1.50 | 7.35B | 3.64M | 144.00 | 8.51M | 27-Nov-2025 14:30:16.720 |
| ZENITHBANK | 60.00 | -0.50 | 60.27 | 3.33 | 13.30 | 2.25 | 1,883.79B | 24.56M | 1,189.00 | 1.48B | 27-Nov-2025 14:30:43.010 |
| DAARCOMM | 0.92 | -2.17 | 0.93 | 0.00 | 0.00 | 0.00 | 11.04B | 973.96K | 56.00 | 865.45K | 27-Nov-2025 14:30:14.307 |
| FGSUK2025S2 | 96.00 | -4.17 | 96.40 | 0.00 | 0.00 | 4.87K | 3.00 | 4.68M | 27-Nov-2025 14:30:44.510 | ||
| ROYALEX | 1.90 | -4.21 | 1.92 | 0.00 | 0.00 | 7.81 | 9.78B | 1.61M | 52.00 | 2.99M | 27-Nov-2025 14:30:16.457 |
| VETBANK | 13.00 | -7.69 | 13.66 | 0.00 | 0.00 | 8.36K | 9.00 | 115.93K | 27-Nov-2025 14:30:40.987 | ||
| STERLINGNG | 7.15 | -9.09 | 7.38 | 15.75 | 0.30 | 3.19 | 205.85B | 8.51M | 329.00 | 63.68M | 27-Nov-2025 14:30:16.623 |
| VETINDETF | 55.00 | -9.09 | 58.07 | 0.00 | 0.00 | 942.00 | 8.00 | 52.52K | 27-Nov-2025 14:30:41.067 | ||
| VETGRIF30 | 58.10 | -10.15 | 58.84 | 0.00 | 0.00 | 6.10K | 15.00 | 390.30K | 27-Nov-2025 14:30:41.040 |
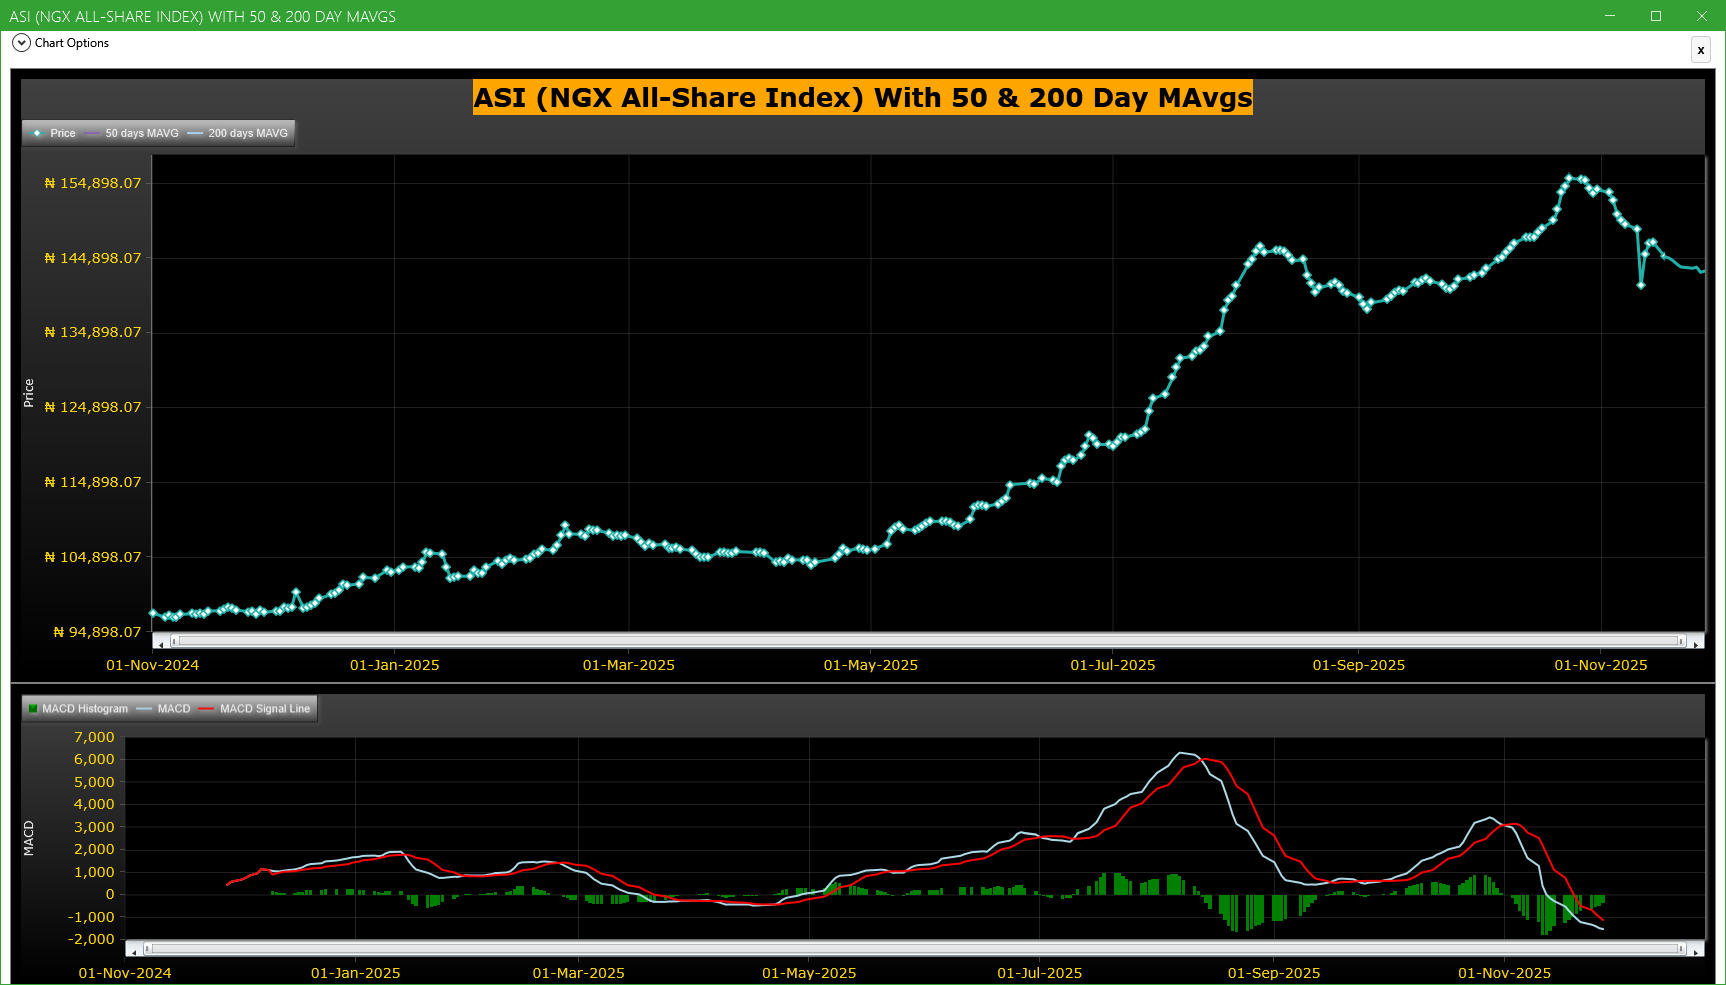
Market Trend - ASI (NGX All-Share-Index) With 50 & 200 Day MAvgs Chart
Technical traders typically use the 50 & 200 day moving averages to aid in choosing
where to enter or exit a position, which then causes these levels to act as strong
support or resistance. As a general guideline, if the price is above a moving average,
the trend is up. If the price is below a moving average, the trend is down.
It is important to note that critics of technical analysis say that moving averages act
as support and resistance because so many traders use these indicators to inform their
trading decisions. Also moving averages tend to work quite well in strong trending conditions
but poorly in choppy or ranging conditions.
Trading Strategies: Crossovers
Crossovers are one of the main moving average strategies. The first type is a price crossover,
which is when the price crosses above or below a moving average to signal a potential change
in trend. Another strategy is to apply two moving averages to a chart: one longer and one
shorter. When the shorter-term MA crosses above the longer-term MA, it is a buy signal, as
it indicates that the trend is shifting up. This is known as a golden cross. Meanwhile, when
the shorter-term MA crosses below the longer-term MA, it is a sell signal, as it indicates that
the trend is shifting down. This is known as a dead/death cross
For more detailed analysis,
- On InfoWARE Market Data Terminal <CI> <GO>
- On InfoWARE Finance Mobile App ( Android , iPhone & iPad and Windows 10) , "Research"
Unusual Volume: Volume traded is more than double the 90 day moving average (All exchanges; ASI & ASem). For more detailed analysis,
- On InfoWARE Market Data Terminal <UV> <GO>
- On InfoWARE Finance Mobile App ( Android , iPhone & iPad and Windows 10)
| Symbol | Name | Volume | 90DAvgVol | %VolChg | Price | LClose | %Chg | Trades | Value |
|---|---|---|---|---|---|---|---|---|---|
| IKEJAHOTEL | IKEJA HOTEL PLC | 2.77M | 447.38K | 518.78 | 27.50 | 25.00 | 10.00 | 238 | 74.08M |
| TRANSPOWER | TRANSCORP POWER PLC | 1.39M | 205.58K | 577.66 | 307.00 | 307.80 | -0.26 | 110 | 394.92M |
| BETAGLAS | BETA GLASS CO PLC. | 321.08K | 149.90K | 114.20 | 370.00 | 370.00 | 0.00 | 179 | 106.98M |
| NNFM | N NIG. FLOUR MILLS PLC. | 214.29K | 76.71K | 179.37 | 84.30 | 84.30 | 0.00 | 24 | 16.26M |
| STANBICETF30 | STANBIC IBTC ETF 30 | 11.26K | 3.54K | 217.72 | 958.00 | 880.00 | 8.86 | 64 | 10.42M |
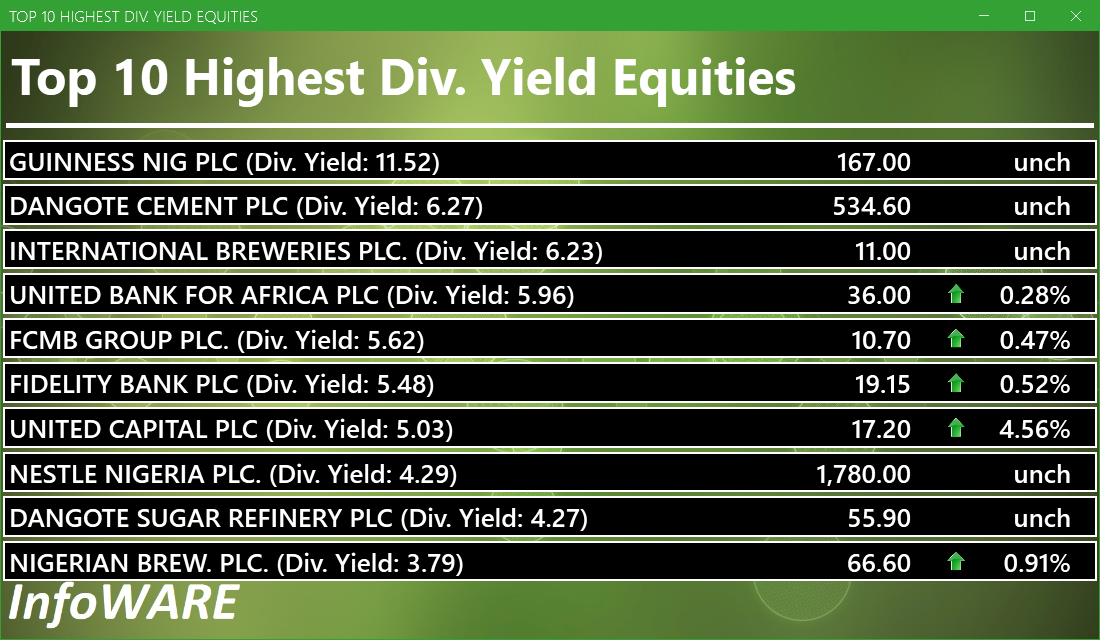
Investment Insights - High Div. Stocks
Dividend stocks distribute a portion of the company earnings to investors on a regular basis and they can a great choice for investors looking for regular income. As an investment or trading strategy, high dividend yield equities provide annual cash payments as against mostly capital gains in the price of a stock. The list in the table below represent the highest dividend paying stocks from the list of the most liquid stocks in the NSE top 30.
For more detailed analysis,
- On InfoWARE Market Data Terminal <HYIELD> <GO>
- On InfoWARE Finance Mobile App ( Android , iPhone & iPad and Windows 10) , "Research"
African Markets
| Name | LClose | Change | %Chg |
|---|---|---|---|
| BRVM Stock Exchange | 345.01 | 1.34 | 0.39 |
| Botswana Stock Exchange | 10,644.71 | 18.07 | 0.17 |
| Egyptian Exchange | 39,537.25 | -367.12 | -0.92 |
| Ghana Stock Exchange | 8,587.31 | 29.10 | 0.34 |
| Johannesburg Stock Exchange | 110,295.20 | 275.05 | 0.25 |
| Lusaka Stock Exchange | 25,352.46 | -30.46 | -0.12 |
| Casablanca Stock Exchange | 18,382.71 | 45.84 | 0.25 |
| Malawi Stock Exchange | 623,705.98 | -1,062.11 | -0.17 |
| Nigeria Stock Exchange | 143,763.13 | 143.62 | 0.10 |
| Nairobi Securities Exchange | 182.52 | -3.59 | -1.93 |
| Namibian Stock Exchange | 1,987.91 | 23.38 | 1.19 |
| Rwanda Stock Exchange | 179.20 | 0.00 | 0.00 |
| Tunis Stock Exchange | 13,211.66 | -19.85 | -0.15 |
| Uganda Securities Exchange | 1,578.68 | -6.66 | -0.42 |
Nigeria Market Indexes
| Symbol | LClose | %Chg | WTD% | MTD% | QTD% | YTD% | MktCap | Trades |
|---|---|---|---|---|---|---|---|---|
| ASI | 143,239.23 | 0.12 | -0.26 | -6.83 | 0.18 | 38.82 | 17,017 | |
| NGX30 | 5,239.20 | 0.16 | -0.35 | -7.07 | 0.41 | 37.34 | 9,349 | |
| NGXAFRBVI | 3,095.43 | 0.08 | 0.92 | -6.72 | -12.79 | 24.78 | 3,969 | |
| NGXAFRHDYI | 20,692.99 | 0.76 | 1.11 | -5.07 | -7.04 | 21.53 | 4,437 | |
| NGXASEM | 1,392.88 | 0.00 | 0.00 | 0.00 | -9.44 | -12.05 | 3 | |
| NGXBNK | 1,378.34 | 0.07 | 0.69 | -5.80 | -9.13 | 26.75 | 4,256 | |
| NGXCG | 3,830.88 | 0.34 | 0.60 | -6.28 | -5.43 | 35.40 | 8,662 | |
| NGXCNSMRGDS | 3,401.92 | 0.08 | -1.24 | -4.21 | 0.57 | 96.15 | 2,192 | |
| NGXCOMMDTY | 1,182.24 | -0.04 | -0.04 | -2.11 | 5.38 | 18.22 | ||
| NGXGROWTH | 14,023.12 | 0.03 | -0.32 | -9.58 | -6.96 | 80.64 | 196 | |
| NGXINDUSTR | 5,126.71 | -0.02 | -2.05 | -13.92 | 1.16 | 43.54 | 1,452 | |
| NGXINS | 1,108.07 | 1.27 | 3.09 | -8.65 | -7.36 | 40.94 | 1,185 | |
| NGXLOTUSISLM | 12,757.38 | 0.13 | 0.17 | -6.27 | 7.47 | 83.09 | 3,015 | |
| NGXMAINBOARD | 6,995.59 | 0.01 | -0.64 | -4.55 | -0.70 | 39.80 | 12,119 | |
| NGXMERIGRW | 9,928.56 | 0.14 | 0.11 | -3.79 | 0.26 | 52.20 | 2,475 | |
| NGXMERIVAL | 12,244.47 | 0.06 | 0.59 | -6.03 | -8.40 | 17.39 | 4,783 | |
| NGXOILGAS | 2,704.32 | -0.01 | -0.04 | -3.35 | 7.06 | -0.25 | 272 | |
| NGXPENBRD | 2,691.86 | 0.15 | -0.05 | -6.26 | 1.54 | 46.97 | 13,988 | |
| NGXPENSION | 6,609.43 | 0.17 | 0.52 | -4.96 | -1.91 | 45.77 | 10,527 | |
| NGXPREMIUM | 14,057.69 | 0.35 | 0.48 | -10.52 | 2.67 | 44.43 | 4,702 | |
| NGXSOVBND | 672.94 | 0.19 | 4.18 | 0.68 | 2.38 | 11.87 | 0 |
For more detailed analysis,
- On InfoWARE Market Data Terminal <MKTINS> <GO>
- On InfoWARE Finance Mobile App ( Android, iPhone & iPad and Windows 10) , "Market Indexes"
Find the topic interesting? Will like to comment? Contact Us at solutions@infowarelimited.com
Top News

Chart Of The Day - ASI Chart Vs ASI Advance Decline Line (YTD) (27-Nov-2025 15:10:19.888)
InfoWARE AI Analyst Daily Market Report: 27-Nov-2025

[XNSA]>> CORDROS MILESTONE FUNDS' BID & OFFER PRICES
[XNSA]>> DAILY FUND PRICE SUBMISSION - FCMB ASSET MANAGEMENT LIMITED
[VSPBONDETF]>> DAILY INDICATIVE PRICES
[XNSA]>> OFF MARKET TRADE
[XNSA]>> H2 2025 BC/DR TEST
[SIAMLETF40]>> DAILY INDICATIVE PRICES
[XNSA]>>GO-LIVE NOTIFICATION: TRANSITION TO T+2 SETTLEMENT CYCLE
Chart Of The Day - ASI Chart Vs ASI Advance Decline Line (YTD) (26-Nov-2025 15:06:38.553)
InfoWARE AI Analyst Daily Market Report: 26-Nov-2025
[XNSA]>> CORDROS MILESTONE FUNDS' BID & OFFER PRICES
Breaking News! Unusual Volume Alert (26-Nov-2025 12:21:07.528)
Breaking News! Bulls Momentum Alert (26-Nov-2025 12:21:06.428)
Breaking News! Bears Momentum Alert (26-Nov-2025 12:21:06.315)
[VETINDETF]>> DAILY INDICATIVE PRICES
[XNSA]>> H2 2025 BC/DR TEST
[XNSA]>> AELP CAPACITY BUILDING & ASSDA FORUM
[SIAMLETF40]>> DAILY INDICATIVE PRICES
[XNSA]>> NOTIFICATION OF PRICE ADJUSTMENT
[XNSA]>>GO-LIVE NOTIFICATION: TRANSITION TO T+2 SETTLEMENT CYCLE
Chart Of The Day - ASI Chart Vs ASI Advance Decline Line (YTD) (25-Nov-2025 15:06:38.995)
InfoWARE AI Analyst Daily Market Report: 25-Nov-2025
[VETGOODS]>> DAILY INDICATIVE PRICES
[XNSA]>> H2 2025 BC/DR TEST
[XNSA]>> AELP CAPACITY BUILDING & ASSDA FORUM
[XNSA]>> RESIGNATION OF A DIRECTOR (TRANSWORLD INVESTMENT AND SECURITIES LIMITED
[STANBICETF30]>> DAILY INDICATIVE PRICES
[XNSA]>> CORDROS MILESTONE FUNDS' BID & OFFER PRICES
[XNSA]>>GO-LIVE NOTIFICATION: TRANSITION TO T+2 SETTLEMENT CYCLE
Get IDIA - the stock trading app for the modern investor
Solutions by Business
Product Suites
Company
Contacts
- 8th Floor,
- South Atlantic Petroleum Towers,
- 1 Adeola Odeku Street,
- Victoria Island,
- Lagos, Nigeria.
- Email: solutions@infowarelimited.com
Follow Us
 |
 |
 |
 |