


InfoWARE AI Analyst Daily Market Report: 28-Nov-2025 | InfoWARE Finance
Get IDIA - the stock trading app for the modern investor


InfoWARE AI Analyst Daily Market Report: 28-Nov-2025
(Source: InfoWARE Terminal, Date: 28-Nov-2025)
Dear Investor,
NGX Market Overview – Friday, November 28, 2025
The NGX All-Share Index (ASI) closed up 0.20% at 143,239.23, extending its remarkable 39.10% YTD rally as the year draws to a close. Market turnover surged 14.97% to ₦12.73bn, signaling a fresh bout of risk appetite from both retail and institutional players. Advancers outpaced decliners by 1.54x, with 37 gainers and 24 laggards, reflecting a healthy market breadth in favor of bulls. Notably, overall trading volume jumped to 488.11 million shares (vs 300.37m previous day), with 72 stocks seeing volume upticks. IKEJA HOTEL PLC led the day's charge, while MERISTEM VALUE ETF pared gains, closing limit down.
Market Breadth & Trend Highlights
- Breadth: 1.54x ratio favors advancers (37) over decliners (24)—bullish undertone.
- Turnover: Jumped 15% sequentially, with institutional trades dominating value (89.30% of turnover, 74.88% of volume).
- Volume action: 488.1m shares (+62.54% vs. prev. day), showing renewed interest, particularly in ACCESSCORP, ELLAHLAKES, and CONHALLPLC (all exhibited >2x 90-day avg volume).
- Momentum: Top gainers (IKEJA HOTEL, NGXGROUP, STANBICETF30) exhibiting strong bullish technicals (MA crossovers, high RSI); key losers (GREENWETF, MEYER) show persistent weakness and negative momentum.
Top Gainers and Losers
| Symbol | Name | Change (%) | RSI | MACD | 15DMA vs 50DMA | Comments |
|---|---|---|---|---|---|---|
| Ikejahotel | IKEJA HOTEL PLC | +10.00% | 79.44 | +1.32 | Above / Bullish | YTD gain now +145%, multi-timeframe bullish (also 5D, WTD, MTD), high RSI suggests overbought short-term. |
| NGXGROUP | NIGERIAN EXCHANGE GROUP | +9.98% | 21.98 | -1.77 | Above / Bullish | Strong close above 15DMA + high institutional interest. RSI flagged as low (contrarian oversold?), but MACD negative. |
| STANBICETF30 | STANBIC IBTC ETF 30 | +9.39% | 78.24 | +97.33 | Above / Bullish | Both YTD and 5D top performer, incredible short-term momentum; ease on entry as RSI approaches extreme. |
| GREENWETF | GREENWICH ASSET ETF | -10.00% | 43.52 | +3.80 | Below / Bearish | YTD loss at -41%; heavy ETF outflow risk, watch for mean-reversion. |
| MEYER | MEYER PLC | -9.97% | 18.59 | -0.18 | Below / Bearish | Persistent downtrend (-18.9% 5D, -21.8% QTD, -55.4% YTD), extreme negative momentum, possible capitulation zone. |
Insights, Unusual Volumes & Patterns
- Turnover Implications: Turnover jump and wide participation shows both speculation and possible institutional repositioning; high-volume buzz in ACCESSCORP, ELLAHLAKES (+599% above 90DAvgVol), and CONHALLPLC (+204%)—traders should watch for continuation or sudden reversals when such extremes occur.
- Advancers/Decliners: Advancers consistently outpaced decliners all week, indicating broad-based buying, a positive setup for persistent strength into month-end.
- Momentum Overlaps:
- Most top 5 gainers (IKEJAHOTEL, STANBICETF30, NGXGROUP) also show up in bullish momentum lists, confirming strong technical underpinning.
- MERVALUE is unique—appeared both as a top gainer and as a limiting-down ETF (potential profit-taking, short-term caution advised).
- Notable overlap: Linkage Assurance (LINKASSURE) appears in both unusual volume and bearish momentum tables; today's heavy selloff (-8.72%) with RSI 45.6 suggests possible bottom-fishing setup ahead if support holds.
- Bullish RSIs: IKEJA HOTEL (RSI 79.4), STANBICETF30 (RSI 78.2), UACN (RSI 71.8)—all above 70; shows overbought but buyers in firm control.
- Bearish RSIs: MEYER (RSI 18.6) and ABBEYBDS (RSI 32.8) deeply oversold; potential technical rebound ahead?
- MACD & MA Crossover:
- IKEJA HOTEL, STANBICETF30, and several gainers closed above both 15DMA and 50DMA; bullish confirmation.
- Losers like CILEASING and SOVRENINS now trade below support moving averages; expect continued pressure unless volume reversal emerges.
Contrarian Signals
- NGXGROUP: Closed up 9.98% with RSI just 21.98 (typically oversold zone); yet price broke above 15DMA/50DMA and high institutional participation. Contrarian opportunity: Recent up-move could spark catch-up momentum from lagging funds.
- LINKASSURE: Heavy negative day (-8.72%), unusual volume (+271%), low but not oversold RSI (45.6): could suggest forced/stop-loss selling rather than true breakdown. Fast money may look for technical bounce.
- MERVALUE: Both among top gainers and the top loser (likely due to intra-day round trip or ETF rebalancing). High RSI (56+) but MACD weakening—mixed signals, exercise caution.
Sector Heatmap
| Sector | Major Performer | % Change | Technical Signal | Institutional Focus |
|---|---|---|---|---|
| Other Financials | ACCESSCORP, NGXGROUP |
ACCESSCORP: +0.0% NGXGROUP: +9.98% |
ACCESSCORP: Unusual volume (+141%) NGXGROUP: Closed above 15DMA/50DMA |
ACCESSCORP: 17.8% of Institutional volume |
| Banking | UBA, ZENITHBANK, GTCO |
UBA: +1.3% ZENITHBANK: 0.0% |
Both trade close to 50DMA; modest RSI. |
UBA: 6.48% of inst. volume ZENITHBANK: 2.44% of inst. volume |
| Insurance | LINKASSURE, SOVRENINS, CONHALLPLC |
LINKASSURE: -8.72% SOVRENINS: -10.0% |
High volume, bearish momentum; RSI in mid-40s to 30s. Several below 15DMA after breakdown. |
Retail-driven, notable outflows. |
| Agriculture/Crop | ELLAHLAKES (Unusual Vol), OMATEK | ELLAHLAKES: +5.32% | Unusual Volume (+599%); technical challenge ahead above 13.8 level. | Primarily retail flows |
Dividend-Beta Matrix
| Symbol | Name | Dividend Yield (%) | Beta | Recent Momentum | Implications |
|---|---|---|---|---|---|
| ROYALEX | ROYAL EXCHANGE | 7.81 | 0.96 | Bullish (Above 15DMA) | High yield + moderate beta; strong defensive candidate for yield-seeking investors. |
| CAVERTON | CAVERTON OS SUPPORT | 5.52 | 0.98 | Bullish crossover | Positive technical momentum with defensive beta; yield play with upside. |
| LINKASSURE | LINKAGE ASSURANCE | 5.56 | 0.41 | Bearish, oversold | Dividend attractive, but technical weakness suggests caution for timing. |
| SOVRENINS | SOV TRUST INSURANCE | 3.75 | 1.12 | Bears (Below 15DMA) | Above market yield but volatile; only for high risk-tolerant, value contrarians. |
NOTE: No high-yielding stocks among the most bullish momentum names today (bulls are chasing growth, not income).
Institutional Clustering Alerts
- ZENITHBANK: 20.17% of total institutional trade value share—a clear indicaton of continued fund manager interest despite lack of price change.
- ACCESSCORP: Accounted for 17.81% of institutional trade volume and 15.38% of inst. trade value. With price flat but volume +141% above average, accumulation may be underway.
- NGXGROUP: Institutional trades 0.52% of total value (noted for volatility; active fund flows today).
Trading Suggestions & Opportunities
- Bullish continuation candidates: IKEJA HOTEL (but overbought, watch for pullbacks), STANBICETF30, NGXGROUP (fresh momentum, rising institutional flows), UACN (fastest MTD/5D gainers, RSI above 70).
- Potential bounce/reversal: MEYER (deeply oversold but showing capitulation), ABBEYBDS, SUNUASSUR—all with double-digit YTD/5D drops and deeply negative RSI. Risk-tolerant contrarians may start building test trades.
- Stocks to monitor for volume reversals: ACCESSCORP, ELLAHLAKES, CONHALLPLC, LINKASSURE. If intraday volume persists and price stabilizes, reversal potential increases.
- Defensive yield idea: ROYALEX, CAVERTON—attractive yield, solid beta, fresh bullish signals.
- Caution on: LINKASSURE & SOVRENINS—both exhibit high yield but under technical selling pressure; wait for volume switch or reversal signals.
Top Year-To-Date (YTD) Gainers and Losers
| Gainers (Symbol) | Price | %ChgYTD | RSI | Momentum | Losers (Symbol) | Price | %ChgYTD | RSI | Momentum |
|---|---|---|---|---|---|---|---|---|---|
| Ikejahotel | 27.50 | +144.94 | 79.44 | Bullish | MEYER | 14.55 | -55.4 | 18.59 | Bearish |
| NCR | 54.65 | +893.64 | 99.50 | Extreme | GREENWETF | 350.00 | -41.0 | 43.52 | Bearish |
| STANBICETF30 | 958.00 | +184.0 | 78.24 | Bullish | UPDC | 5.02 | -190.17 | 35.52 | Bearish |
| UACN | 76.50 | +139.45 | 71.79 | Bullish | SUNUASSUR | 4.35 | -66.35 | 36.44 | Bearish |
| CWG | 17.95 | +140.94 | 57.44 | Bullish | CILEASING | 5.32 | -19.81 | 42.84 | Bearish |
Market Activity & Trade Type Insights
- Institutional dominance: Institutions made up 89.30% of trade value and 74.88% of volume, but just 38.4% of trades. Implication: Institutions focus on block/high-value trades (longer-term accumulation or repositioning).
- Retail activity: 61.6% of trades but only 10.7% value, reflecting small ticket/quick turnover deals—prime for short-term momentum or noise.
-
Top institutional trades:
- UBA (largest in trade count, 6.5% of inst. vol), ZENITHBANK (6.05% inst. vol), ACCESSCORP (15.4% of inst. value!), GTCO, and NGXGROUP.
- Notably: ACCESSCORP traded +141% over normal volume (block accumulation?), but price unchanged—potential stealth bid.
-
Top retail trades:
- MTNN (volume up 11.98%), ACCESSCORP, UBA, ZENITHBANK, and STERLINGNG.
- Overlap with institutional names (UBA, ACCESSCORP, ZENITHBANK) shows these banks are deeply liquid battlegrounds for all investor types.
-
Combined view:
- Stocks with both high institutional volume and retail trade (e.g., ACCESSCORP, UBA, ZENITHBANK) tend to see tighter bid/ask, fast liquidity, and are suitable for short-term swing and longer-term accumulation strategies.
- Names with abnormal volume but limited price progress (e.g., ACCESSCORP, CONHALLPLC) may be in silent accumulation or distribution phases—close monitoring for sudden breakouts/breakdowns warranted.
Hidden & Subtle Insights for Investors
- ETF Volatility: Both MERVALUE and GREENWETF cycled from top gainers to top losers, driven by crowded positions and/or portfolio rebalancing. Caution for trend followers as ETF liquidity can be fickle, and technical reversals can be sudden.
- Persistent Momentum: All top 3 YTD gainers (IKEJA HOTEL, NCR, STANBICETF30) are showing consistent multi-period strength (also among top 5D/MTD gainers), showing no immediate signs of exhaustion despite high RSI. This momentum persistence supports "winners keep winning" thesis for now.
- Contrarian Setups: Several insurance names (LINKASSURE, SOVRENINS) with high yield are deeply oversold, underperforming even as market rallies—suggests sectoral rotation away from defensive yield plays for now.
Naira Watch
The Naira appreciated 0.55% to 1,447/$, adding to risk-on sentiment and potentially attracting increased offshore interest.
This summary seeks not just to inform, but equip you to spot evolving narratives—use order flow (especially in high-volume names), MA crossovers, and the interplay between yield and momentum for nuanced positioning. Always mind the macro liquidity pulses and watch for sectoral rotations driven by institutional clusters. Risk management should take precedence as December approaches and volatility could rise near year end.
|
Top ASI Gainers Over Last 5 Trading Days
|
Top ASI Losers Over Last 5 Trading Days
|
For more detailed analysis, on InfoWARE Market Data Terminal <NSEPERF> <GO>
On InfoWARE Finance Mobile App (Android, iPhone & iPad, Windows Phone and Windows 8/10), "Top Gainers & Losers"
IKEJA HOTEL PLC (Ikejahotel) topped the advancers list closing at N30.25 with a gain of 10.00% followed by MERISTEM VALUE EXCHANGE TRADED FUND (MERVALUE) which closed at N242.00 with a gain of 10.00%.
On the flip side ABBEY BUILDING SOCIETY PLC (ABBEYBDS) and GREENWICH ASSET ETF (GREENWETF) topped the decliners log with a loss of -10.00% at a close of N5.85, and -10.00% to close the day at N315.00 respectively.
| Symbol | LClose | %Chg |
|---|---|---|
| Ikejahotel | 30.25 | 10.00 |
| MERVALUE | 242.00 | 10.00 |
| NGXGROUP | 56.20 | 9.98 |
| ACADEMY | 7.35 | 9.70 |
| STANBICETF30 | 1,048.00 | 9.39 |
For more detailed analysis,
- On InfoWARE Market Data Terminal <TOPG> <GO>
- On InfoWARE Finance Mobile App ( Android, iPhone & iPad and Windows 10) , "Top Gainers & Losers"
Currency Market
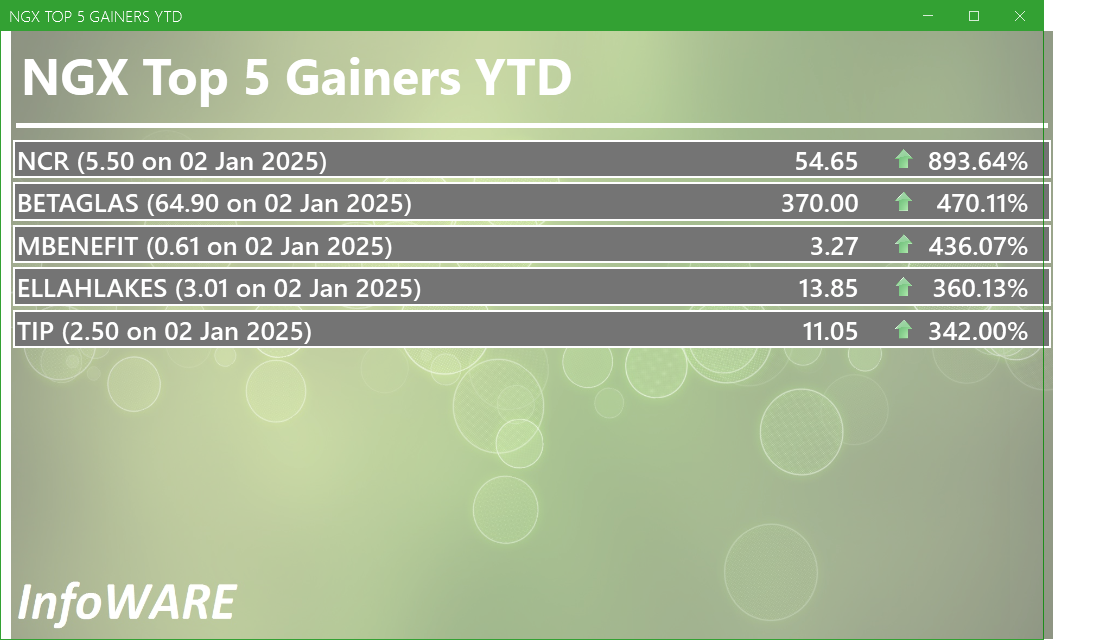
In the currency market, the Naira appreciated 0.55%(7.98) against the Dollar to settle at 1 to 1Investment Insights - Top 5 Gainers YTD
These stocks are the best performers whose price has risen faster than the market as a whole with the best returns year to date. Momentum investors believe that stocks that have outperformed the market will often continue to do so because the factors that caused them to outperform will not suddenly disappear. In addition, other investors seeking to benefit from the stock’s outperformance will often purchase the stock, further bidding its price higher and pushing the stock higher still
For more detailed analysis,
- On InfoWARE Market Data Terminal <T5YTD2> <GO>
- On InfoWARE Finance Mobile App ( Android , iPhone & iPad and Windows 10) , "Research"
NSE: Bull Signal - Price crossed above 15 Day MA
This signal implies these stocks are under buying pressure and the price might continue to rise and therefore positions should be monitored closely. Further suggested analysis include looking at the overall market (ASI) to see if the uptrend is market wide, sector wide or specific to the stock. Portfolio managers tend to use this as a signal to do more research to add to their positions or lock in some profits. Typically further analysis should be done using commands like PC and RV on the InfoWARE Market Data Terminal. Another command is ALERTS to set price triggers for possible exit or entry as necessary
For more detailed analysis,
- On InfoWARE Market Data Terminal <NSEPERF> <GO>
- On InfoWARE Finance Mobile App ( Android , iPhone & iPad and Windows 10) , "Top Gainers & Losers"
| Symbol | Price | %Chg | 15DMA | PE | EPS | DivY | MktCap | Vol | Trades | Value | LstTradeTime |
|---|---|---|---|---|---|---|---|---|---|---|---|
| MERVALUE | 242.00 | 9.09 | 221.91 | 0.00 | 0.00 | 1.48K | 7.00 | 338.90K | 28-Nov-2025 14:30:28.000 | ||
| NGXGROUP | 56.20 | 9.07 | 52.83 | 0.00 | 0.00 | 2.73 | 110.38B | 3.33M | 156.00 | 179.62M | 28-Nov-2025 14:30:11.717 |
| ACADEMY | 7.35 | 8.84 | 6.81 | 0.00 | 0.00 | 3.51 | 5.56B | 1.02M | 28.00 | 7.47M | 28-Nov-2025 14:30:09.747 |
| LEGENDINT | 5.60 | 6.07 | 5.51 | 0.00 | 0.00 | 979.32K | 32.00 | 5.38M | 28-Nov-2025 14:30:11.317 | ||
| CAVERTON | 5.15 | 3.88 | 5.02 | 1.15 | 1.57 | 5.52 | 17.26B | 312.43K | 35.00 | 1.59M | 28-Nov-2025 14:30:10.230 |
| JAPAULGOLD | 2.20 | 3.64 | 2.17 | 0.19 | 12.01 | 0.90 | 13.78B | 5.30M | 121.00 | 11.21M | 28-Nov-2025 14:30:27.840 |
| ROYALEX | 1.95 | 2.56 | 1.92 | 0.00 | 0.00 | 7.81 | 10.03B | 3.82M | 57.00 | 7.54M | 28-Nov-2025 14:30:12.107 |
| CORNERST | 6.00 | 1.67 | 5.96 | 8.62 | 0.35 | 5.28 | 109.00B | 1.04M | 41.00 | 5.89M | 28-Nov-2025 14:30:10.400 |
| UNIONDICON | 7.00 | 1.43 | 6.95 | 0.00 | 0.00 | 6.25 | 1.91B | 518.84K | 37.00 | 3.63M | 28-Nov-2025 14:30:12.580 |
| WAPCO | 134.00 | 0.90 | 133.52 | 24.60 | 2.87 | 2.70 | 2,158.44B | 6.40M | 228.00 | 853.23M | 28-Nov-2025 14:30:28.270 |
| NGXPENSION | 6,622.07 | 0.19 | 6,618.64 | 429.80 | 359.59 | 0.00 | 0.00 | 211.61M | 11,690.00 | 10.32B | 28-Nov-2025 14:30:19.423 |
| LOTUSHAL15 | 82.00 | 0.00 | 81.78 | 0.00 | 0.00 | 13.65K | 18.00 | 1.16M | 28-Nov-2025 14:30:30.710 | ||
| MULTIVERSE | 10.05 | 0.00 | 10.00 | 0.00 | 0.00 | 0.85 | 4.28B | 24.06K | 2.00 | 265.81K | 28-Nov-2025 14:30:11.533 |
NSE: BEAR Signal - Price crossed below 15 Day MA
This signal implies these stocks are under selling pressure and the price might continue to slide and therefore positions should be monitored closely. Further suggested analysis include looking at the overall market (ASI) to see if the downtrend is market wide, sector wide or specific to the stock. If the overal market trend is upwards, then since these stocks are heading in the opposite direction, then further analysis should be done using commands like PC and RV on the InfoWARE Market Data Terminal. Another command is ALERTS to set price triggers for possible exit is necessar
For more detailed analysis,
- On InfoWARE Market Data Terminal <BEARM> <GO>
- On InfoWARE Finance Mobile App ( Android , iPhone & iPad and Windows 10)
| Symbol | Price | %Chg | 15DMA | PE | EPS | DivY | MktCap | Vol | Trades | Value | LstTradeTime |
|---|---|---|---|---|---|---|---|---|---|---|---|
| FGS202774 | 118.00 | 0.00 | 118.00 | 0.00 | 0.00 | 0.00 | 0.00 | 0.00 | 28-Nov-2025 14:30:18.590 | ||
| FTNCOCOA | 4.90 | -2.04 | 4.93 | 0.00 | 0.00 | 1.60 | 19.11B | 1.77M | 113.00 | 8.71M | 28-Nov-2025 14:30:10.873 |
| AIICO | 3.31 | -6.34 | 3.38 | 2.01 | 0.60 | 4.13 | 121.16B | 3.79M | 277.00 | 13.18M | 28-Nov-2025 14:30:09.850 |
| CILEASING | 4.96 | -7.26 | 5.28 | 6.50 | 0.64 | 1.20 | 3.88B | 538.97K | 40.00 | 2.73M | 28-Nov-2025 14:30:10.300 |
| LINKASSURE | 1.72 | -8.72 | 1.75 | 59.89 | 0.02 | 5.56 | 24.08B | 15.73M | 228.00 | 29.86M | 28-Nov-2025 14:30:11.340 |
| SOVRENINS | 2.70 | -10.00 | 2.95 | 27.95 | 0.03 | 3.75 | 30.68B | 7.48M | 100.00 | 21.45M | 28-Nov-2025 14:30:12.197 |
Economic Indicators - Nigeria FX Reserves Vs ASI Chart
Nigeria FX Reserves are assets held on reserve by CBN in foreign currencies. These reserves are used to back liabilities and influence monetary policy. Given the nature of the Nigeria economy, FX Reserves can appear to have an outsize influence on the economy and hence on the capital market. The chart below allows comparison of FX Reserves against the ASI to make investment decisions

For more detailed analysis,
- On InfoWARE Market Data Terminal <CI> <GO>
- On InfoWARE Finance Mobile App ( Android , iPhone & iPad and Windows 10) , "Research"
Market Trend - ASI (NGX All-Share-Index) With 50 & 200 Day MAvgs Chart
Technical traders typically use the 50 & 200 day moving averages to aid in choosing
where to enter or exit a position, which then causes these levels to act as strong
support or resistance. As a general guideline, if the price is above a moving average,
the trend is up. If the price is below a moving average, the trend is down.
It is important to note that critics of technical analysis say that moving averages act
as support and resistance because so many traders use these indicators to inform their
trading decisions. Also moving averages tend to work quite well in strong trending conditions
but poorly in choppy or ranging conditions.
Trading Strategies: Crossovers
Crossovers are one of the main moving average strategies. The first type is a price crossover,
which is when the price crosses above or below a moving average to signal a potential change
in trend. Another strategy is to apply two moving averages to a chart: one longer and one
shorter. When the shorter-term MA crosses above the longer-term MA, it is a buy signal, as
it indicates that the trend is shifting up. This is known as a golden cross. Meanwhile, when
the shorter-term MA crosses below the longer-term MA, it is a sell signal, as it indicates that
the trend is shifting down. This is known as a dead/death cross

For more detailed analysis,
- On InfoWARE Market Data Terminal <CI> <GO>
- On InfoWARE Finance Mobile App ( Android , iPhone & iPad and Windows 10) , "Research"
Unusual Volume: Volume traded is more than double the 90 day moving average (All exchanges; ASI & ASem). For more detailed analysis,
- On InfoWARE Market Data Terminal <UV> <GO>
- On InfoWARE Finance Mobile App ( Android , iPhone & iPad and Windows 10)
| Symbol | Name | Volume | 90DAvgVol | %VolChg | Price | LClose | %Chg | Trades | Value |
|---|---|---|---|---|---|---|---|---|---|
| ACCESSCORP | Access Holdings PLC | 103.29M | 42.83M | 141.19 | 21.00 | 21.00 | 0.00 | 1,040 | 2.17B |
| ELLAHLAKES | ELLAH LAKES PLC. | 82.71M | 11.83M | 599.16 | 13.85 | 13.15 | 5.32 | 585 | 1.10B |
| CONHALLPLC | CONSOLIDATED HALLMARK INSURANCE PLC | 59.14M | 19.40M | 204.89 | 3.72 | 3.96 | -6.06 | 88 | 232.53M |
| LINKASSURE | LINKAGE ASSURANCE PLC | 15.73M | 4.24M | 270.89 | 1.72 | 1.87 | -8.02 | 228 | 29.86M |
| UPDC | UPDC PLC | 5.95M | 2.79M | 113.16 | 5.02 | 5.02 | 0.00 | 256 | 30.23M |
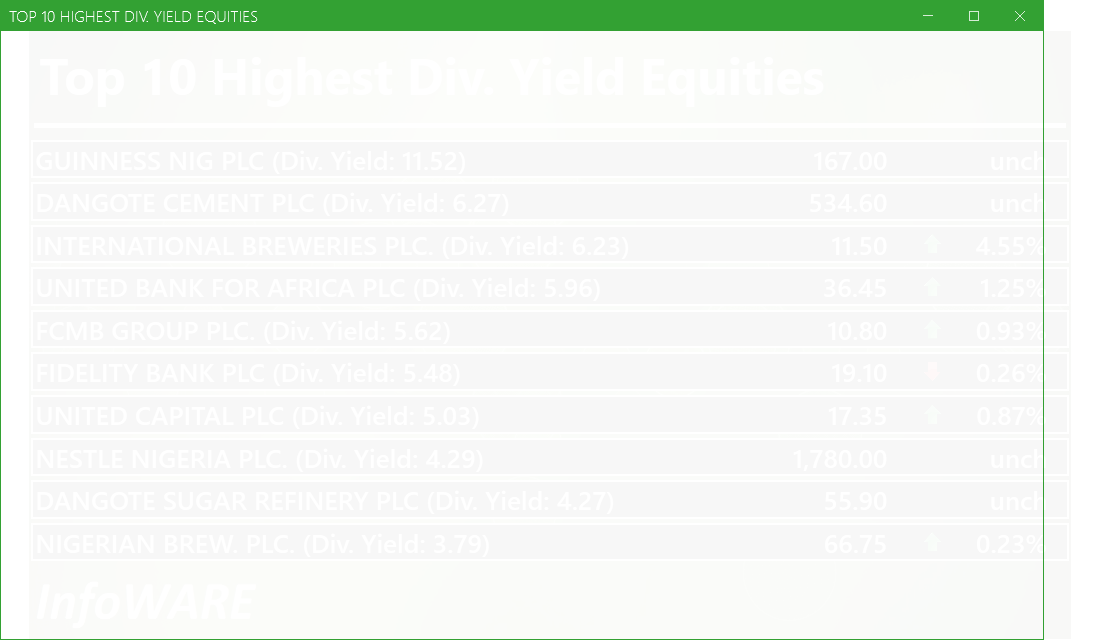
Investment Insights - High Div. Stocks
Dividend stocks distribute a portion of the company earnings to investors on a regular basis and they can a great choice for investors looking for regular income. As an investment or trading strategy, high dividend yield equities provide annual cash payments as against mostly capital gains in the price of a stock. The list in the table below represent the highest dividend paying stocks from the list of the most liquid stocks in the NSE top 30.
For more detailed analysis,
- On InfoWARE Market Data Terminal <HYIELD> <GO>
- On InfoWARE Finance Mobile App ( Android , iPhone & iPad and Windows 10) , "Research"
Investment Insights - Stocks outperforming the ASI but with approximately the same risk
These list of stocks represent equities that are less risky than the ASI but doing better than the ASI (All Shares Index) using the YTD (Year to Date) returns as the measure. The risk is measured by Beta. Beta is an assessment of a stock's tendency to undergo price changes, (its volatility), as well as its potential returns compared to the ASI. It is expressed as a ratio, where a score of 1 represents performance comparable to the ASI, and returns above or below the market may receive scores greater or lower than 1.
For a full list of both positively and negatively corelated stocks visit InfoWARE Market Data Terminal
- On InfoWARE Market Data Terminal <BANL> <GO>
- On InfoWARE Finance Mobile App ( Android , iPhone & iPad and Windows 10)
| Symbol | DivYield | PE | EPS | Beta | %ChgYTD | ASIYTDReturn | BetaDiff |
|---|---|---|---|---|---|---|---|
| HONYFLOUR | 1.40 | 16.28 | 0.31 | 0.99 | 163.73 | 39.10 | 0.01 |
| CAVERTON | 5.52 | 1.15 | 1.57 | 0.98 | 101.96 | 39.10 | 0.02 |
| ROYALEX | 7.81 | 0.00 | 0.00 | 0.96 | 77.27 | 39.10 | 0.04 |
| CORNERST | 5.28 | 8.62 | 0.35 | 0.93 | 51.52 | 39.10 | 0.07 |
| UNIVINSURE | 0.00 | 0.00 | 0.00 | 0.83 | 62.50 | 39.10 | 0.17 |
| FTNCOCOA | 1.60 | 0.00 | 0.00 | 0.79 | 160.64 | 39.10 | 0.21 |
| NB | 3.79 | 16.95 | 1.60 | 0.79 | 108.59 | 39.10 | 0.21 |
| MAYBAKER | 3.75 | 58.94 | 0.14 | 0.78 | 81.38 | 39.10 | 0.22 |
| UNILEVER | 2.81 | 67.09 | 0.40 | 0.75 | 100.00 | 39.10 | 0.25 |
| VETGOODS | 0.00 | 0.71 | 120.93 | 39.10 | 0.29 |
African Markets
| Name | LClose | Change | %Chg |
|---|---|---|---|
| BRVM Stock Exchange | 347.22 | 2.21 | 0.64 |
| Botswana Stock Exchange | 10,678.35 | 2.14 | 0.02 |
| Egyptian Exchange | 40,039.24 | 502.12 | 1.27 |
| Ghana Stock Exchange | 8,584.17 | -26.69 | -0.31 |
| Johannesburg Stock Exchange | 110,567.90 | -1,297.64 | -1.16 |
| Lusaka Stock Exchange | 25,175.93 | -52.98 | -0.21 |
| Casablanca Stock Exchange | 18,640.63 | 257.37 | 1.40 |
| Malawi Stock Exchange | 621,421.01 | -497.53 | -0.08 |
| Nigeria Stock Exchange | 143,239.23 | 171.68 | 0.12 |
| Nairobi Securities Exchange | 180.38 | -1.44 | -0.79 |
| Namibian Stock Exchange | 1,997.25 | -15.70 | -0.78 |
| Rwanda Stock Exchange | 179.20 | 0.00 | 0.00 |
| Tunis Stock Exchange | 13,119.90 | -21.03 | -0.16 |
| Uganda Securities Exchange | 1,543.83 | -11.04 | -0.71 |
Nigeria Market Indexes
| Symbol | LClose | %Chg | WTD% | MTD% | QTD% | YTD% | MktCap | Trades |
|---|---|---|---|---|---|---|---|---|
| ASI | 143,520.51 | 0.20 | -0.07 | -6.65 | 0.38 | 39.10 | 19,505 | |
| NGX30 | 5,249.90 | 0.20 | -0.14 | -6.88 | 0.61 | 37.62 | 10,533 | |
| NGXAFRBVI | 3,105.51 | 0.33 | 1.25 | -6.42 | -12.51 | 25.18 | 4,115 | |
| NGXAFRHDYI | 20,766.50 | 0.36 | 1.47 | -4.73 | -6.71 | 21.96 | 4,532 | |
| NGXASEM | 1,392.88 | 0.00 | 0.00 | 0.00 | -9.44 | -12.05 | 1 | |
| NGXBNK | 1,381.81 | 0.25 | 0.94 | -5.56 | -8.90 | 27.07 | 4,846 | |
| NGXCG | 3,837.59 | 0.18 | 0.78 | -6.12 | -5.27 | 35.64 | 9,451 | |
| NGXCNSMRGDS | 3,421.15 | 0.57 | -0.68 | -3.67 | 1.13 | 97.26 | 2,143 | |
| NGXCOMMDTY | 1,182.24 | 0.00 | -0.04 | -2.11 | 5.38 | 18.22 | ||
| NGXGROWTH | 14,019.07 | -0.03 | -0.35 | -9.60 | -6.99 | 80.59 | 317 | |
| NGXINDUSTR | 5,133.60 | 0.13 | -1.92 | -13.80 | 1.30 | 43.73 | 1,424 | |
| NGXINS | 1,082.66 | -2.29 | 0.73 | -10.75 | -9.48 | 37.71 | 1,472 | |
| NGXLOTUSISLM | 12,778.55 | 0.17 | 0.33 | -6.12 | 7.64 | 83.39 | 3,254 | |
| NGXMAINBOARD | 7,010.33 | 0.21 | -0.43 | -4.35 | -0.49 | 40.10 | 13,925 | |
| NGXMERIGRW | 9,969.52 | 0.41 | 0.53 | -3.39 | 0.67 | 52.83 | 3,010 | |
| NGXMERIVAL | 12,291.11 | 0.38 | 0.97 | -5.68 | -8.06 | 17.84 | 5,178 | |
| NGXOILGAS | 2,699.31 | -0.19 | -0.23 | -3.53 | 6.86 | -0.44 | 361 | |
| NGXPENBRD | 2,694.99 | 0.12 | 0.06 | -6.15 | 1.66 | 47.14 | 15,585 | |
| NGXPENSION | 6,622.07 | 0.19 | 0.71 | -4.78 | -1.72 | 46.05 | 11,690 | |
| NGXPREMIUM | 14,079.68 | 0.16 | 0.63 | -10.38 | 2.83 | 44.66 | 5,263 | |
| NGXSOVBND | 672.94 | 0.00 | 4.18 | 0.68 | 2.38 | 11.87 | 0 |
For more detailed analysis,
- On InfoWARE Market Data Terminal <MKTINS> <GO>
- On InfoWARE Finance Mobile App ( Android, iPhone & iPad and Windows 10) , "Market Indexes"
Find the topic interesting? Will like to comment? Contact Us at solutions@infowarelimited.com
Top News

InfoWARE AI Analyst Weekly Market Report: 28-Nov-2025
Chart Of The Day - ASI Chart Vs ASI Advance Decline Line (YTD) (28-Nov-2025 15:06:42.196)
InfoWARE AI Analyst Daily Market Report: 28-Nov-2025
Breaking News! Unusual Volume Alert (28-Nov-2025 14:21:07.760)
Breaking News! Bulls Momentum Alert (28-Nov-2025 14:21:06.675)
Breaking News! Bears Momentum Alert (28-Nov-2025 14:21:06.590)

[XNSA]>> OFF MARKET TRADE
[XNSA]>> IMPERIAL ASSET MANAGERS LIMITED - APPOINTMENT OF DIRECTORS
[XNSA]>> OFF MARKET TRADE
[XNSA]>> DAILY FUND PRICE SUBMISSION - FCMB ASSET MANAGEMENT LIMITED
[XNSA]>> NORRENBERGER MUTUAL FUNDS WEEKLY UPDATE
[XNSA]>> VFD GROUP PLC: EXTENSION FOR TRADING IN RIGHTS ISSUE
[SIAMLETF40]>> DAILY INDICATIVE PRICES
[VSPBONDETF]>> DAILY INDICATIVE PRICES
[XNSA]>> CORDROS MILESTONE FUNDS' BID & OFFER PRICES
[XNSA]>> H2 2025 BC/DR TEST
[XNSA]>>GO-LIVE NOTIFICATION: TRANSITION TO T+2 SETTLEMENT CYCLE
Chart Of The Day - ASI Chart Vs ASI Advance Decline Line (YTD) (27-Nov-2025 15:10:19.888)
InfoWARE AI Analyst Daily Market Report: 27-Nov-2025
[XNSA]>> CORDROS MILESTONE FUNDS' BID & OFFER PRICES
[XNSA]>> DAILY FUND PRICE SUBMISSION - FCMB ASSET MANAGEMENT LIMITED
[VSPBONDETF]>> DAILY INDICATIVE PRICES
[XNSA]>> OFF MARKET TRADE
[XNSA]>> H2 2025 BC/DR TEST
[SIAMLETF40]>> DAILY INDICATIVE PRICES
[XNSA]>>GO-LIVE NOTIFICATION: TRANSITION TO T+2 SETTLEMENT CYCLE
Chart Of The Day - ASI Chart Vs ASI Advance Decline Line (YTD) (26-Nov-2025 15:06:38.553)
InfoWARE AI Analyst Daily Market Report: 26-Nov-2025
[XNSA]>> CORDROS MILESTONE FUNDS' BID & OFFER PRICES
Breaking News! Unusual Volume Alert (26-Nov-2025 12:21:07.528)
Get IDIA - the stock trading app for the modern investor
Solutions by Business
Product Suites
Company
Contacts
- 8th Floor,
- South Atlantic Petroleum Towers,
- 1 Adeola Odeku Street,
- Victoria Island,
- Lagos, Nigeria.
- Email: solutions@infowarelimited.com
Follow Us
 |
 |
 |
 |