


InfoWARE AI Analyst Daily Market Report: 14-Aug-2025 | InfoWARE Finance
Get IDIA - the stock trading app for the modern investor


InfoWARE AI Analyst Daily Market Report: 14-Aug-2025
(Source: InfoWARE Terminal, Date: 14-Aug-2025)
Dear Investor,
Daily NGX Market Summary – Thursday, August 14, 2025
The NGX All Share Index retreated modestly today, dipping -0.34% to close at 145,864.80, despite recording an outsized surge in market turnover to a robust ₦20.51B (up 468.16% from yesterday), signaling heavy institutional trading. While the year-to-date return remains impressive at 40.89%, market breadth deteriorated (0.51x) with decliners nearly doubling advancers. Notably, large volumes flooded select insurance stocks, and bullish momentum picks emerged in mid- and small-caps, juxtaposed with persistent weakness in high-beta and defensive names. Contrarian signals and sector divergences abound, offering tactical opportunities for nimble investors.
Key Market Breadth and Turnover Trends
- Market Breadth: Only 28 advancers vs. 55 decliners (breadth ratio 0.51x), confirming a decisively negative tilt. However, turnover and trade volume exploded, especially in institutional blocks.
- Volume Surge: Total traded volume spiked to 2.38B shares (vs. 366.37M yesterday). The largest turnover increase was institutional (74% of volume, 82% of value).
- Unusual Volumes (Insurance Focus): Universal Insurance, AIICO, Mutual Benefits, Linkage Assurance, and Regency Alliance all traded >800% above 90D average—an extraordinary rotation into insurers by major players.
Top 5 Daily Gainers & Losers
| Top 5 Gainers | ||||||
|---|---|---|---|---|---|---|
| Stock | Price | %Gain | RSI | MACD | Volatility | Notes |
| MERGROWTH | 1,070.08 | 10.00% | 83.44 | 119.26 | 1.15 | ETF, RSI in extreme overbought; watch for reversal |
| AUSTINLAZ | 2.33 | 9.91% | 28.98 | -0.04 | 0.44 | Strong price momentum despite neutral RSI |
| NCR | 8.70 | 9.43% | 93.97 | 0.41 | 0.39 | RSI at extreme overbought; flag for potential mean reversion |
| VETGOODS | 35.00 | 9.03% | 57.77 | 1.30 | 0.70 | ETF, moderate RSI; buyers in consumer space |
| THOMASWY | 3.70 | 8.19% | 56.76 | 0.23 | 0.93 | Rebounding small cap |
| Top 5 Losers | ||||||
| LASACO | 4.50 | -10.00% | 80.44 | 0.35 | 1.05 | Overbought RSI, sharp pullback despite buying pressure |
| WEMABANK | 20.70 | -10.00% | 65.33 | 1.93 | 0.78 | High MACD, persistent YTD downtrend |
| CILEASING | 7.20 | -10.00% | 60.07 | 0.40 | 1.03 | Bearish, no relief despite neutral RSI/MACD |
| SOVRENINS | 3.24 | -10.00% | 86.43 | 0.48 | 1.09 | Sharp drop, technical sell signals |
| UPDC | 7.20 | -10.00% | 75.36 | 1.05 | 0.88 | High volatility, heavy selloff |
Stock-Specific Notable Patterns
- MERGROWTH and NCR both have dangerously high RSI readings (above 80 & 90), warning of potentially overextended rallies.
- Insurance sector featured both top gainers and top losers and had multiple entries in the unusual volume report, indicating sector-wide speculative flows.
- WEMABANK top loser on both daily and YTD basis—signals sustained institutional exodus.
Year-to-Date Gainers & Losers: Persistent Leaders and Laggards
| YTD Top 5 Gainers (5D %) | YTD Top 5 Losers (5D %) | ||||||||||
|---|---|---|---|---|---|---|---|---|---|---|---|
| Stock | Price | %Chg5Dys | RSI | DivYield | YTD % | Stock | Price | %Chg5Dys | RSI | DivYield | YTD % |
| MERGROWTH | 972.80 | 33.09 | 83.44 | 0.00 | 171.25 | UPDC | 8.00 | -17.15 | 75.36 | 34.25 | 316.18 |
| MECURE | 19.10 | 20.50 | 81.17 | 0.00 | 48.64 | DANGSUGAR | 57.00 | -11.02 | 49.51 | 4.27 | 61.53 |
| TRIPPLEG | 5.17 | 20.23 | 84.13 | 5.32 | 129.78 | WEMABANK | 23.00 | -10.58 | 65.33 | 5.81 | 127.47 |
| LINKASSURE | 2.72 | 19.47 | 88.75 | 5.56 | 109.30 | CUSTODIAN | 41.00 | -10.50 | 65.94 | 1.20 | 119.30 |
| GUINEAINS | 1.67 | 16.54 | 81.12 | 1.96 | 82.02 | UNILEVER | 71.30 | -9.85 | 58.52 | 2.81 | 98.33 |
- Gainers: MERGROWTH and TRIPPLEG, with RSIs above 80, are at risk of short-term corrections—a classic warning for profit-takers.
- Losers: Most YTD losers like UPDC and CUSTODIAN still maintain high RSIs (>65), suggesting technical rebounds may be likely on short-covering, but further downside is possible.
- High yield names like GUINEAINS (DivYield 1.96%) are among the YTD gainers, suggesting stability and flight-to-dividends during broader volatility.
Bullish vs Bearish Momentum: Crossover and RSI Insights
| Bullish Momentum (Closed Above 15 DMA) | ||||||
|---|---|---|---|---|---|---|
| Stock | Price | %Chg | RSI | 15DMA vs 50DMA (Sparkline) | DivYield | Notes |
| JULI | 9.90 | 9.09% | - | 0.68 | Food/Drug; Illiquid spike | |
| AUSTINLAZ | 2.33 | 9.01% | 28.98 | - | Momentum leader, breaking out | |
| VETGOODS | 35.00 | 8.29% | 57.77 | - | ETF: Consumer goods rotation | |
| CHAMS | 2.95 | 7.46% | 48.99 | 1.56 | Value favorite; high retail activity | |
| UBA | 48.30 | 0.52% | - | 5.96 | Banking; blue-chip interest | |
| Bearish Momentum (Closed Below 15 DMA) | ||||||
| Stock | Price | %Chg | RSI | 15DMA vs 50DMA (Sparkline) | DivYield | Notes |
| MTNN | 460.00 | 0.00% | - | 3.29 | Heavyweight stuck below resistance | |
| MAYBAKER | 17.90 | -0.56% | 52.91 | 3.75 | Pharma; consolidating lower | |
| CUSTODIAN | 37.50 | -9.33% | 65.94 | 1.20 | Defensive, but institutional exits | |
| WEMABANK | 20.70 | -11.11% | 65.33 | 5.81 | Persistent selloff, momentum breakdown | |
| LIVESTOCK | 8.10 | -10.49% | 53.12 | 2.94 | Animal proteins, technical selling | |
- Bullish breakouts in lower-mkt cap stocks like AUSTINLAZ and CHAMS, and in banking names like UBA, suggest speculative retail sentiment remains alive even as overall market breadth sours.
- Bearish momentum dominates in high-beta financials (WEMABANK, CUSTODIAN), a sign of institutional de-risking.
Contrarian Signals
- LASACO dropped -10% but has a high RSI (80.44) and positive MACD, indicating ongoing buying on dips—value buyers may step in, but caution warranted.
- CILEASING is markedly oversold by price, but RSI (60) and MACD remain neutral—look for potential bounce (perhaps short-lived).
- CHAMS shows mixed technicals: RSI at 48.99 (neutral), but price has crossed above 15DMA and shows bullish signs, even with low PE. Watch for renewed momentum.
- MERGROWTH has an overbought RSI (83.44) & large price gain; late buyers may be chasing. Classic risk of reversal or institutional profit-taking.
Sector Heatmaps & Institutional vs Retail Dynamics
| Sector | Daily Trend | Institutional Activity | Retail Activity | Tech Trend (RSI sparkline) |
|---|---|---|---|---|
| Insurance | Volatile, Mixed | Universal Ins. (390M); AIICO (183M); Linkage (180M) | AIICO (53M), MBENEFIT, REGALINS | |
| Banking | Weak | ZENITHBANK (14.5M), UBA (11M), ACCESSCORP | UBA, MTNN, ACCESSCORP | |
| ETFs | Strong rally | MERGROWTH, VETGOODS, VETBNK | MERGROWTH, VETGOODS | |
| Food/Drug | Mixed/illiquid spike | JULI | JULI |
- Insurance is the epicenter of activity—dominated by outsized volume and both gainers/losers, suggesting speculative churn and possible sector reallocation.
- Banking stocks are under selling pressure—with WEMABANK and CUSTODIAN breaking down below 15DMA, and institutional flows clearly reducing exposures.
- ETFs (MERGROWTH, VETGOODS) saw broad-based buying, likely as "catch-up" plays or hedge proxies.
Dividend–Beta Matrix: Defensive Ideas
| Stock | Div. Yield | Beta | Status |
|---|---|---|---|
| AFRIPRUD | 1.27% | 0.64 | Bearish momentum, caution on yield play |
| GUINEAINS | 1.96% | 1.51 | In YTD top gainers, high-yield + momentum |
| CHAMS | 1.56% | 1.16 | Retail-driven, bullish break above 15DMA |
| UBA | 5.96% | 1.56 | Bullish, but large cap banking flows |
Insight: Look for high dividend but mid-low beta stocks (e.g. AFRIPRUD with 1.27% Yield, Beta 0.64)—currently in a bearish phase, but attractive for long-term defensive re-entry on further weakness.
Several high-yield stocks (AFRIPRUD, UBA, GUINEAINS, CHAMS) are present among momentum or value tables, indicating possible defensive rotation overlays. Watch for reversals upon broad market consolidation.
Institutional Clustering Alerts
- ZENITHBANK: Claimed 20.17% of total institutional trade value with concentrated block trades (14.5M shares). This dominance suggests institutions are sentiment drivers in the tier-1 bank space.
- AIICO and LINKASSURE also showed both high trade counts and trade values, indicating targeted insurance positioning.
Market Activity & Trade Summaries – Institutional vs Retail Patterns
- Institutional investors (42% of trades) accounted for a disproportionate 74% of daily volume and 82% of value, pointing to coordinated, large trades likely for index rebalancing or sector rotation.
- Retail trades are numerous (58% trade count) but only 18% of value—traditional "chase" behavior in small/midcaps like AIICO, JULI, and CHAMS.
- Top 5 most traded by institutionals: ELLAHLAKES (42%), AIICO, ZENITHBANK, ACCESSCORP, LINKASSURE. Notably, four of these appear among unusual volume or technical momentum tables.
- Retail flows cluster in AIICO (insurance), ELLAHLAKES (crop production), ACCESSCORP, MTNN, UBA. Clear theme: speculative retail buying on corporate news or price momentum, while big money exits tier-1 banks.
Correlations and Hidden Patterns
- Insurance as a Cross-Theme: AIICO, LINKASSURE, and UNIVINSURE are among the most traded, highest volume, and feature daily in both retail and institutional tables.
- Volume Clusters: Heavy volume cluster aligns with declining breadth—usually market capitulation warning sign.
- Banking sector outflows from institutions (ZENITHBANK, ACCESSCORP) follow a price downtrend in sector indices and broad decline in financials trading below key moving averages.
Noteworthy Stock Overlaps and Insights
- AIICO and LINKASSURE are present in: unusual volume, institutional top trades, retail top trades, and insurance sector rotation. Such overlap hints at speculative and possibly smart-money-driven moves.
- MERGROWTH and VETGOODS lead both ETF gains and momentum lists—these could serve as hedges, but caution as MERGROWTH is flagged as overbought by RSI.
- WEMABANK, CUSTODIAN, LIVESTOCK: All appear as YTD losers, with reinforced bearish technicals (closed below 15DMA, negative MACD). Avoid for now unless mean-reversion signals strengthen.
- AFRIPRUD: High dividend yield and low beta, but now breaking down technically; typically a defensive stock, so dividend hunters should await stabilization.
Suggestions and Tactical Opportunities for Traders
- For momentum chasers: Be wary of top gainers (MERGROWTH, NCR) with extreme RSI—profits may soon be taken.
- Watch insurance stocks with abnormal activity (AIICO, LINKASSURE, UNIVINSURE); the swirl of both speculative and strategic flows may create short-term swings ideal for active traders.
- Defensive/value buyers: Consider dollar-cost-averaging into high-dividend, low-beta names (AFRIPRUD, UBA) on pullbacks, but avoid catching falling knives.
- Caution on banks: The sector is under institutional distribution, with key names (ZENITHBANK, ACCESSCORP, WEMABANK) showing technical breakdowns.
- ETF Rotation: VETGOODS and MERGROWTH are defensive or hedge plays, but avoid chasing late into spiking RSI territory.
Summary of Actionable Insights
- Beware of overbought stocks (MERGROWTH, NCR, LASACO, SOVRENINS) where momentum may fade.
- Monitor buying interest and reversals in high-volume insurance plays—opportunity for quick trades if sector rotation persists.
- Reduce positions in banking and high-beta value laggards until technical signals stabilize.
- Look for defensive value among high-yield, low-beta stocks on further weakness (AFRIPRUD, CHAMS, GUINEAINS).
Hidden Edge: Today's market saw heavy institutional block trades and sectoral shifts, with pronounced insurance sector churn, a defensive bid into high-yield ETFs, and short-term exhaustion in overbought names. The divergence between price and technicals (especially in high RSI names with negative price moves) hints at possible lurking reversals—ideal terrain for contrarian or short-term tactical trading.
|
Top ASI Gainers Over Last 5 Trading Days
|
Top ASI Losers Over Last 5 Trading Days
|
For more detailed analysis, on InfoWARE Market Data Terminal <NSEPERF> <GO>
On InfoWARE Finance Mobile App (Android, iPhone & iPad, Windows Phone and Windows 8/10), "Top Gainers & Losers"
LOTUS HALAL EQUITY ETF (LOTUSHAL15) topped the advancers list closing at N87.12 with a gain of 10.00% followed by MERISTEM GROWTH EXCHANGE TRADED FUND (MERGROWTH) which closed at N1,070.08 with a gain of 10.00%.
On the flip side C & I LEASING PLC. (CILEASING) and LASACO ASSURANCE PLC. (LASACO) topped the decliners log with a loss of -10.00% at a close of N7.20, and -10.00% to close the day at N4.50 respectively.
| Symbol | LClose | %Chg |
|---|---|---|
| LOTUSHAL15 | 87.12 | 10.00 |
| MERGROWTH | 1,070.08 | 10.00 |
| JULI | 9.90 | 10.00 |
| AUSTINLAZ | 2.33 | 9.91 |
| NCR | 8.70 | 9.43 |
For more detailed analysis,
- On InfoWARE Market Data Terminal <TOPG> <GO>
- On InfoWARE Finance Mobile App ( Android, iPhone & iPad and Windows 10) , "Top Gainers & Losers"
Currency Market
In the currency market, the Naira was unchanged against the dollar at 1 to 1NSE: Bull Signal - Price crossed above 15 Day MA
This signal implies these stocks are under buying pressure and the price might continue to rise and therefore positions should be monitored closely. Further suggested analysis include looking at the overall market (ASI) to see if the uptrend is market wide, sector wide or specific to the stock. Portfolio managers tend to use this as a signal to do more research to add to their positions or lock in some profits. Typically further analysis should be done using commands like PC and RV on the InfoWARE Market Data Terminal. Another command is ALERTS to set price triggers for possible exit or entry as necessary
For more detailed analysis,
- On InfoWARE Market Data Terminal <NSEPERF> <GO>
- On InfoWARE Finance Mobile App ( Android , iPhone & iPad and Windows 10) , "Top Gainers & Losers"
| Symbol | Price | %Chg | 15DMA | PE | EPS | DivY | MktCap | Vol | Trades | Value | LstTradeTime |
|---|---|---|---|---|---|---|---|---|---|---|---|
| JULI | 9.90 | 9.09 | 9.58 | 0.00 | 0.00 | 0.68 | 1.98B | 609.06K | 26.00 | 5.37M | 14-Aug-2025 14:30:31.717 |
| AUSTINLAZ | 2.33 | 9.01 | 2.26 | 0.00 | 0.00 | 0.00 | 2.52B | 583.89K | 40.00 | 1.35M | 14-Aug-2025 14:30:22.057 |
| NGXASEM | 1,538.10 | 8.94 | 1,489.19 | 1.55 | 0.34 | 0.00 | 0.00 | 609.06K | 26.00 | 5.37M | 14-Aug-2025 14:30:36.510 |
| VETGOODS | 35.00 | 8.29 | 32.59 | 0.00 | 0.00 | 5.00 | 1.00 | 175.00 | 14-Aug-2025 14:31:06.153 | ||
| CHAMS | 2.95 | 7.46 | 2.85 | 27.02 | 0.07 | 1.56 | 13.85B | 39.80M | 625.00 | 118.17M | 14-Aug-2025 14:30:22.340 |
| UBA | 48.30 | 0.52 | 48.29 | 8.29 | 4.05 | 5.96 | 1,651.83B | 11.25M | 1,144.00 | 543.66M | 14-Aug-2025 14:31:06.693 |
| ACCESSCORP | 27.65 | 0.18 | 27.59 | 8.56 | 2.81 | 1.87 | 982.83B | 46.41M | 1,319.00 | 1.29B | 14-Aug-2025 14:31:06.347 |
NSE: BEAR Signal - Price crossed below 15 Day MA
This signal implies these stocks are under selling pressure and the price might continue to slide and therefore positions should be monitored closely. Further suggested analysis include looking at the overall market (ASI) to see if the downtrend is market wide, sector wide or specific to the stock. If the overal market trend is upwards, then since these stocks are heading in the opposite direction, then further analysis should be done using commands like PC and RV on the InfoWARE Market Data Terminal. Another command is ALERTS to set price triggers for possible exit is necessar
For more detailed analysis,
- On InfoWARE Market Data Terminal <BEARM> <GO>
- On InfoWARE Finance Mobile App ( Android , iPhone & iPad and Windows 10)
| Symbol | Price | %Chg | 15DMA | PE | EPS | DivY | MktCap | Vol | Trades | Value | LstTradeTime |
|---|---|---|---|---|---|---|---|---|---|---|---|
| MTNN | 460.00 | 0.00 | 460.35 | 16,715.80 | 0.01 | 3.29 | 9,363.08B | 595.52K | 1,216.00 | 265.88M | 14-Aug-2025 14:31:06.523 |
| NGXSOVBND | 671.46 | -0.23 | 671.91 | 0.00 | 0.00 | 0.00 | 0.00 | 0.00 | 0.00 | 0.00 | 14-Aug-2025 14:30:36.923 |
| NGXCG | 4,223.11 | -0.45 | 4,249.58 | 443.35 | 327.97 | 0.00 | 0.00 | 338.48M | 15,964.00 | 9.79B | 14-Aug-2025 14:30:36.527 |
| NGXBNK | 1,594.14 | -0.49 | 1,599.54 | 6.10 | 34.65 | 0.00 | 0.00 | 189.73M | 6,549.00 | 4.60B | 14-Aug-2025 14:30:36.520 |
| MAYBAKER | 17.90 | -0.56 | 17.97 | 58.94 | 0.14 | 3.75 | 30.88B | 598.71K | 95.00 | 10.79M | 14-Aug-2025 14:30:23.380 |
| NGXMERIGRW | 10,180.29 | -1.80 | 10,194.74 | 34.89 | 293.99 | 0.00 | 0.00 | 93.05M | 4,551.00 | 1.79B | 14-Aug-2025 14:30:36.813 |
| TRANSCORP | 50.05 | -2.40 | 51.00 | 0.00 | 0.00 | 0.23 | 2,034.43B | 3.60M | 310.00 | 182.07M | 14-Aug-2025 14:30:30.993 |
| AFRIPRUD | 15.40 | -4.22 | 15.92 | 19.57 | 0.61 | 1.27 | 30.80B | 2.37M | 195.00 | 37.64M | 14-Aug-2025 14:30:57.510 |
| MERVALUE | 205.00 | -5.37 | 212.76 | 0.00 | 0.00 | 102.00 | 2.00 | 22.01K | 14-Aug-2025 14:31:05.893 | ||
| FGS202890 | 85.00 | -5.88 | 89.67 | 0.00 | 0.00 | 5.00K | 1.00 | 4.25M | 14-Aug-2025 14:30:36.060 | ||
| NPFMCRFBK | 3.15 | -7.94 | 3.18 | 5.63 | 0.27 | 8.00 | 18.88B | 3.02M | 89.00 | 10.17M | 14-Aug-2025 14:30:30.210 |
| ABCTRANS | 4.53 | -9.27 | 4.86 | 6.68 | 0.17 | 2.19 | 10.84B | 2.11M | 210.00 | 10.94M | 14-Aug-2025 14:30:21.550 |
| CUSTODIAN | 37.50 | -9.33 | 37.75 | 3.80 | 3.29 | 1.20 | 220.57B | 2.34M | 268.00 | 91.91M | 14-Aug-2025 14:30:22.440 |
| ABBEYBDS | 6.23 | -9.95 | 6.43 | 0.00 | 0.00 | 1.43 | 63.26B | 1.61M | 114.00 | 11.44M | 14-Aug-2025 14:30:21.533 |
| FTNCOCOA | 6.30 | -10.00 | 6.32 | 0.00 | 0.00 | 1.60 | 24.57B | 31.88M | 631.00 | 233.85M | 14-Aug-2025 14:30:22.833 |
| LIVESTOCK | 8.10 | -10.49 | 8.47 | 0.00 | 0.00 | 2.94 | 24.30B | 11.25M | 306.00 | 92.67M | 14-Aug-2025 14:30:23.330 |
| WEMABANK | 20.70 | -11.11 | 22.37 | 216.91 | 0.04 | 5.81 | 266.16B | 7.76M | 461.00 | 170.26M | 14-Aug-2025 14:30:31.663 |
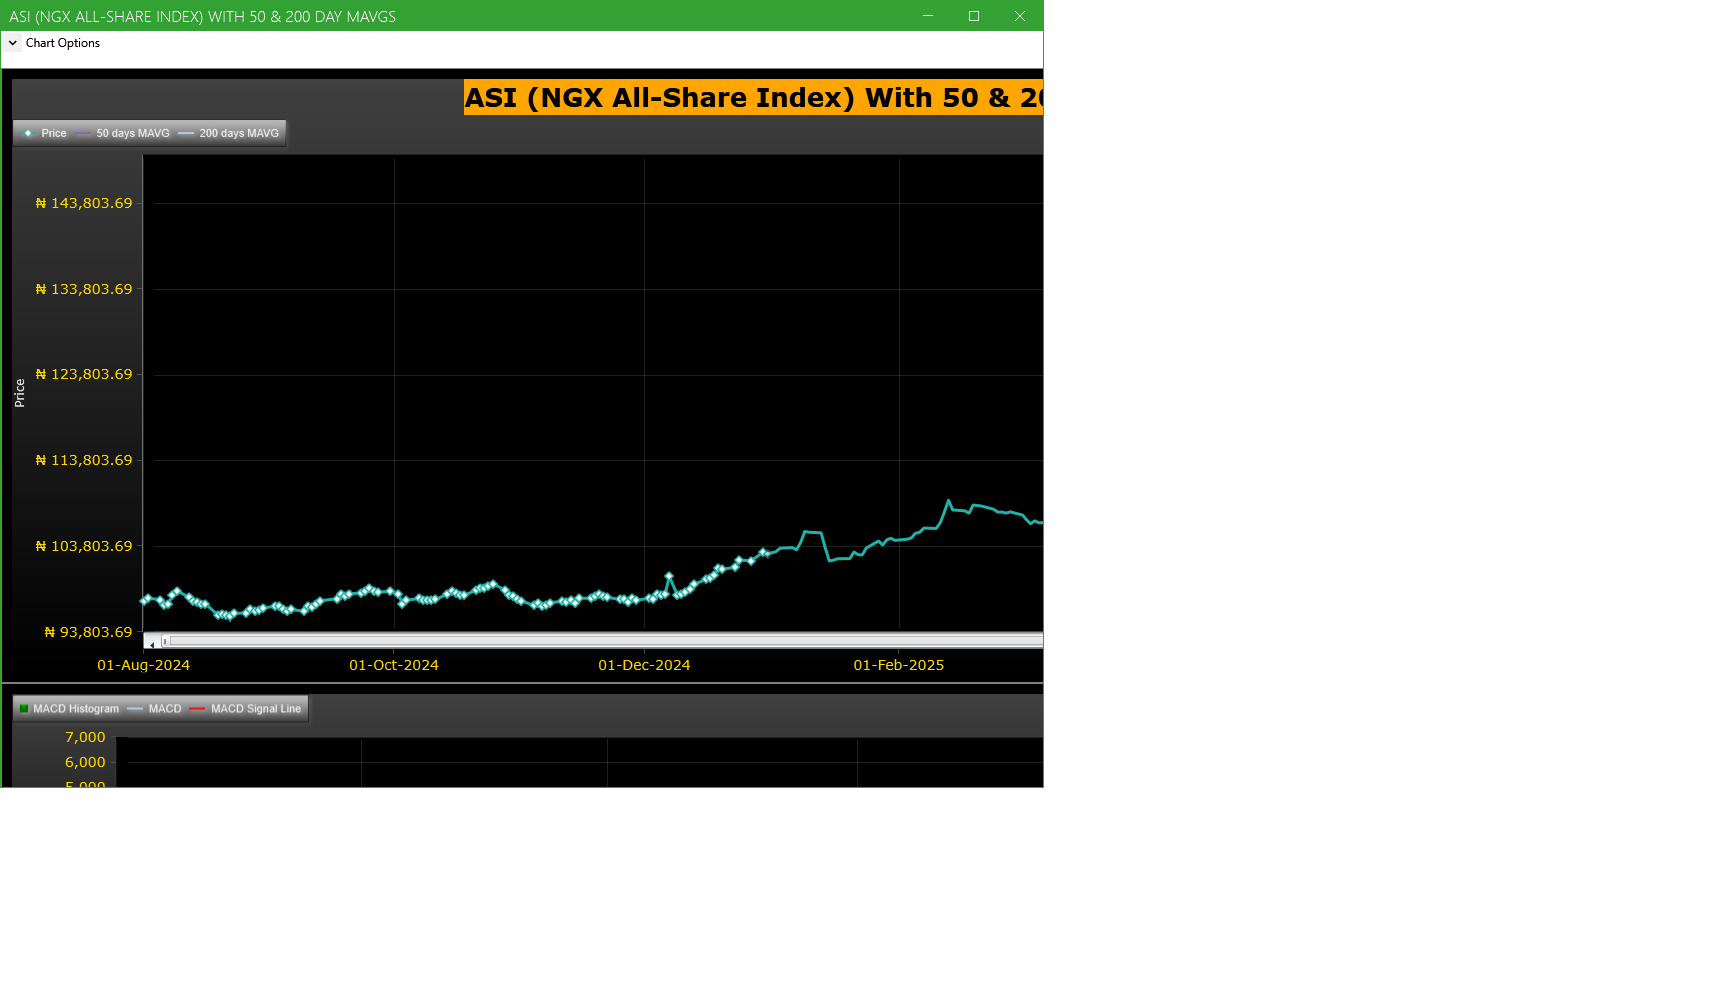
Market Trend - ASI (NGX All-Share-Index) With 50 & 200 Day MAvgs Chart
Technical traders typically use the 50 & 200 day moving averages to aid in choosing
where to enter or exit a position, which then causes these levels to act as strong
support or resistance. As a general guideline, if the price is above a moving average,
the trend is up. If the price is below a moving average, the trend is down.
It is important to note that critics of technical analysis say that moving averages act
as support and resistance because so many traders use these indicators to inform their
trading decisions. Also moving averages tend to work quite well in strong trending conditions
but poorly in choppy or ranging conditions.
Trading Strategies: Crossovers
Crossovers are one of the main moving average strategies. The first type is a price crossover,
which is when the price crosses above or below a moving average to signal a potential change
in trend. Another strategy is to apply two moving averages to a chart: one longer and one
shorter. When the shorter-term MA crosses above the longer-term MA, it is a buy signal, as
it indicates that the trend is shifting up. This is known as a golden cross. Meanwhile, when
the shorter-term MA crosses below the longer-term MA, it is a sell signal, as it indicates that
the trend is shifting down. This is known as a dead/death cross
For more detailed analysis,
- On InfoWARE Market Data Terminal <CI> <GO>
- On InfoWARE Finance Mobile App ( Android , iPhone & iPad and Windows 10) , "Research"
Unusual Volume: Volume traded is more than double the 90 day moving average (All exchanges; ASI & ASem). For more detailed analysis,
- On InfoWARE Market Data Terminal <UV> <GO>
- On InfoWARE Finance Mobile App ( Android , iPhone & iPad and Windows 10)
| Symbol | Name | Volume | 90DAvgVol | %VolChg | Price | LClose | %Chg | Trades | Value |
|---|---|---|---|---|---|---|---|---|---|
| UNIVINSURE | UNIVERSAL INSURANCE COMPANY PLC | 390.40M | 35.89M | 987.63 | 1.32 | 1.46 | -9.59 | 1,039 | 577.44M |
| AIICO | AIICO INSURANCE PLC. | 236.57M | 29.69M | 696.76 | 4.19 | 4.65 | -9.89 | 2,506 | 1.11B |
| LINKASSURE | LINKAGE ASSURANCE PLC | 214.27M | 40.52M | 428.84 | 2.70 | 2.72 | -0.74 | 679 | 589.19M |
| MBENEFIT | MUTUAL BENEFITS ASSURANCE PLC. | 157.53M | 11.26M | 1,298.59 | 3.50 | 3.88 | -9.79 | 1,026 | 638.66M |
| REGALINS | REGENCY ALLIANCE INSURANCE COMPANY PLC | 109.85M | 10.95M | 903.60 | 1.51 | 1.67 | -9.58 | 425 | 191.03M |
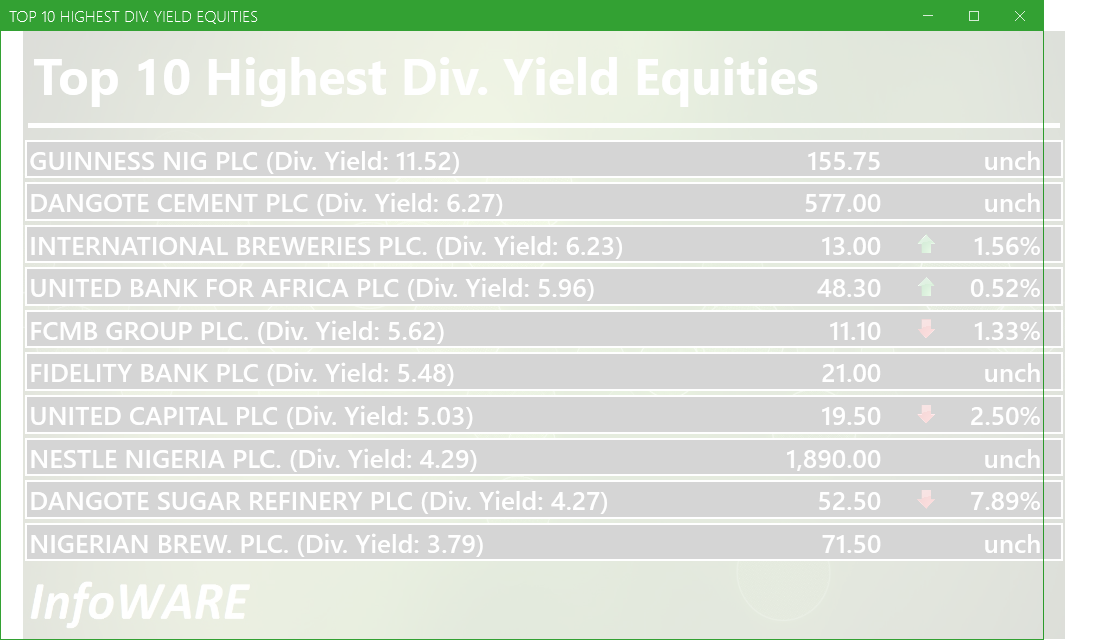
Investment Insights - High Div. Stocks
Dividend stocks distribute a portion of the company earnings to investors on a regular basis and they can a great choice for investors looking for regular income. As an investment or trading strategy, high dividend yield equities provide annual cash payments as against mostly capital gains in the price of a stock. The list in the table below represent the highest dividend paying stocks from the list of the most liquid stocks in the NSE top 30.
For more detailed analysis,
- On InfoWARE Market Data Terminal <HYIELD> <GO>
- On InfoWARE Finance Mobile App ( Android , iPhone & iPad and Windows 10) , "Research"
African Markets
| Name | LClose | Change | %Chg |
|---|---|---|---|
| BRVM Stock Exchange | 313.34 | 0.94 | 0.30 |
| Botswana Stock Exchange | 10,553.06 | 9.49 | 0.09 |
| Egyptian Exchange | 35,855.26 | -147.61 | -0.41 |
| Ghana Stock Exchange | 7,443.29 | 31.13 | 0.42 |
| Lusaka Stock Exchange | 21,971.40 | 46.04 | 0.21 |
| Casablanca Stock Exchange | 19,858.63 | -25.85 | -0.13 |
| Malawi Stock Exchange | 447,158.43 | 44.71 | 0.01 |
| Nigeria Stock Exchange | 145,864.80 | -189.87 | -0.13 |
| Nairobi Securities Exchange | 162.96 | 0.75 | 0.46 |
| Rwanda Stock Exchange | 150.43 | 0.00 | 0.00 |
| Uganda Securities Exchange | 1,365.09 | -1.50 | -0.11 |
Nigeria Market Indexes
| Symbol | LClose | %Chg | WTD% | MTD% | QTD% | YTD% | MktCap | Trades |
|---|---|---|---|---|---|---|---|---|
| ASI | 145,367.03 | -0.34 | -0.40 | 2.91 | 21.40 | 40.89 | 41,028 | |
| NGX30 | 5,302.92 | -0.15 | -0.50 | 2.26 | 12.26 | 39.01 | 13,405 | |
| NGXAFRBVI | 3,729.59 | -0.24 | -1.51 | -2.22 | 5.25 | 50.34 | 4,792 | |
| NGXAFRHDYI | 23,403.84 | -0.77 | 0.99 | 0.77 | 11.91 | 37.45 | 5,872 | |
| NGXASEM | 1,538.10 | 9.82 | -0.98 | 6.34 | -3.57 | -2.88 | 26 | |
| NGXBNK | 1,594.14 | -0.48 | -1.22 | -1.53 | 5.52 | 46.60 | 6,549 | |
| NGXCG | 4,223.11 | -0.45 | -1.10 | -1.82 | 22.81 | 49.27 | 15,964 | |
| NGXCNSMRGDS | 3,202.87 | -0.20 | -1.58 | 7.60 | -7.66 | 84.67 | 3,797 | |
| NGXCOMMDTY | 1,070.03 | 0.00 | -0.03 | -2.36 | 2.18 | 7.00 | ||
| NGXGROWTH | 11,410.22 | -0.36 | 12.96 | 3.09 | 19.99 | 46.98 | 391 | |
| NGXINDUSTR | 5,451.31 | 0.11 | 0.65 | 7.82 | 54.74 | 52.63 | 2,113 | |
| NGXINS | 1,482.67 | -8.28 | 8.03 | 67.17 | 100.74 | 88.59 | 11,685 | |
| NGXLOTUSISLM | 11,968.24 | 0.08 | 0.25 | 2.95 | 25.00 | 71.76 | 4,710 | |
| NGXMAINBOARD | 6,942.46 | -0.54 | -0.71 | 4.57 | 17.69 | 38.74 | 34,769 | |
| NGXMERIGRW | 10,180.29 | -1.77 | -1.18 | -1.25 | 5.47 | 56.06 | 4,551 | |
| NGXMERIVAL | 14,054.96 | -0.34 | -0.97 | -3.24 | 17.64 | 34.75 | 7,168 | |
| NGXOILGAS | 2,422.82 | -0.11 | -0.18 | -0.57 | 1.28 | -10.64 | 467 | |
| NGXPENBRD | 2,688.57 | -0.32 | -0.30 | 3.16 | 16.93 | 46.79 | 29,267 | |
| NGXPENSION | 6,863.99 | -0.25 | -0.54 | -0.73 | 8.02 | 51.39 | 16,189 | |
| NGXPREMIUM | 14,747.72 | 0.03 | 0.09 | -0.12 | 28.58 | 51.52 | 5,868 | |
| NGXSOVBND | 671.46 | -0.23 | -0.23 | -0.21 | 2.75 | 11.62 | 0 |
For more detailed analysis,
- On InfoWARE Market Data Terminal <MKTINS> <GO>
- On InfoWARE Finance Mobile App ( Android, iPhone & iPad and Windows 10) , "Market Indexes"
Find the topic interesting? Will like to comment? Contact Us at solutions@infowarelimited.com
Top News

Chart Of The Day - ASI Chart Vs ASI Advance Decline Line (YTD) (15-Aug-2025 15:07:13.864)
InfoWARE Analyst Daily Market Report (15-Aug-2025 15:07:09.387)

[XNSA]>> DAILY FUND PRICE SUBMISSION - FCMB ASSET MANAGEMENT LIMITED
[XNSA]>> NGX FIXED INCOME INDICATIVE PRICE LIST FOR AUGUST 15, 2025
[OANDO]>>Corporate Disclosures-<OANDO PLC>
[ETI]>>Corporate Disclosures-<ECOBANK TRANSNATIONAL INCORPORATED>
[XNSA]>> NORRENBERGER MUTUAL FUNDS WEEKLY UPDATE TO NGX
[VSPBONDETF]>> DAILY INDICATIVE PRICES
[XNSA]>> REGISTRATION FOR BATCH TWO- 2025 DEALING CLERKSHIP CERTIFICATION PROGRA
[XNSA]>> CORDROS MILESTONE FUNDS' BID & OFFER PRICES
[STANBICETF30]>> DAILY INDICATIVE PRICES
[XNSA]>> RETIREMENT OF DIRECTORS (UNITED CAPITAL SECURITIES LIMITED)
[XNSA]>> APPOINTMENT OF DIRECTORS (STANDARD ALLIANCE CAPITAL AND ASSET MANAGEMEN
[XNSA]>> NGX NON-INTEREST FINANCE BOARD LAUNCH COMMUNIQUE
[XNSA]>> SAVE THE DATE: 29TH ANNUAL STOCKBROKERS CONFERENCE
Chart Of The Day - ASI Chart Vs ASI Advance Decline Line (YTD) (14-Aug-2025 15:10:24.791)
InfoWARE AI Analyst Daily Market Report: 14-Aug-2025
[XNSA]>> CORDROS MILESTONE FUNDS' BID & OFFER PRICES
[XNSA]>> DAILY FUND PRICE SUBMISSION - FCMB ASSET MANAGEMENT LIMITED
[XNSA]>> CIS ACADEMY TRAINING
[VSPBONDETF]>> DAILY INDICATIVE PRICES
[PRESCO]>>Corporate Disclosures-<PRESCO PLC>
[WAPIC]>>Corporate Disclosures-<CORONATION INSURANCE PLC>
[XNSA]>> MARKET BULLETIN - APPOINTMENT OF DIRECTORS (FIRST SECURITIES BROKERS LI
[XNSA]>> NGX NON-INTEREST FINANCE BOARD LAUNCH COMMUNIQUE
[XNSA]>> SAVE THE DATE: 29TH ANNUAL STOCKBROKERS CONFERENCE
[SIAMLETF40]>> DAILY INDICATIVE PRICES
[XNSA]>> NOTIFICATION OF PRICE ADJUSTMENT
Chart Of The Day - ASI Chart Vs ASI Advance Decline Line (YTD) (13-Aug-2025 15:11:35.049)
InfoWARE AI Analyst Daily Market Report: 13-Aug-2025
Get IDIA - the stock trading app for the modern investor
Solutions by Business
Product Suites
Company
Contacts
- 8th Floor,
- South Atlantic Petroleum Towers,
- 1 Adeola Odeku Street,
- Victoria Island,
- Lagos, Nigeria.
- Email: solutions@infowarelimited.com
Follow Us
 |
 |
 |
 |