


InfoWARE AI Analyst Daily Market Report: 06-Nov-2025 | InfoWARE Finance
Get IDIA - the stock trading app for the modern investor


InfoWARE AI Analyst Daily Market Report: 06-Nov-2025
(Source: InfoWARE Terminal, Date: 06-Nov-2025)
Dear Investor,
NGX Daily Market Summary – Thursday, November 6, 2025
Market Overview
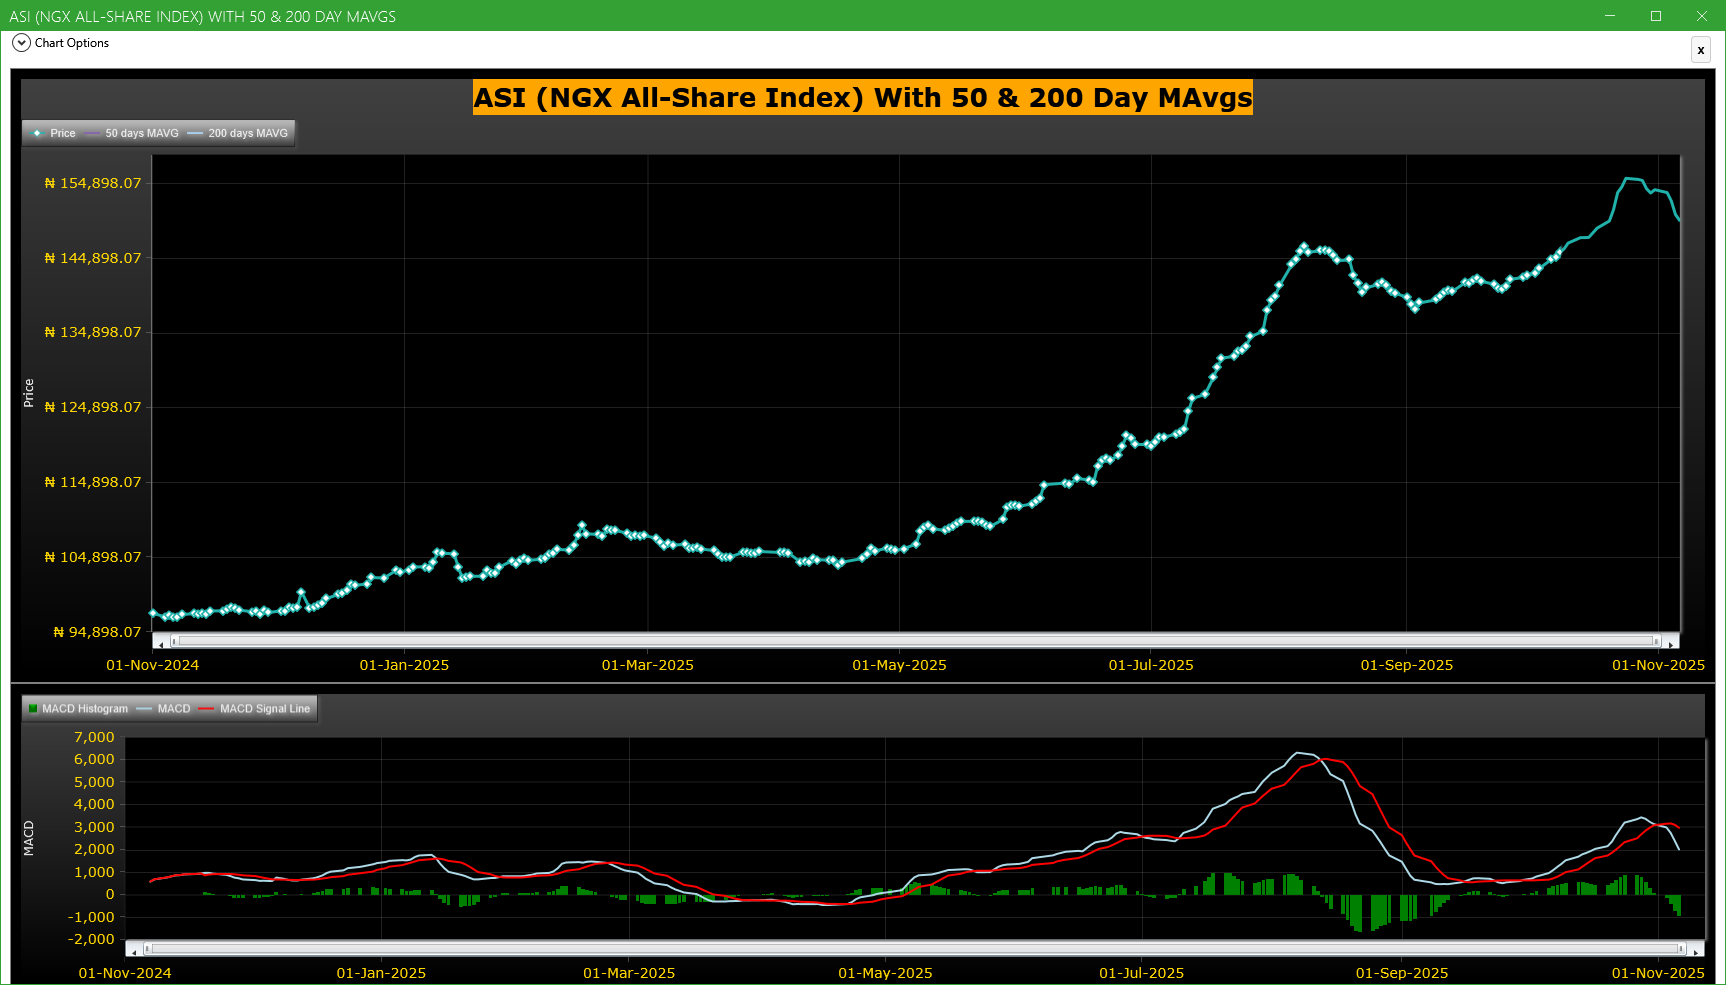
The Nigerian equities market closed down -0.36% on Thursday, with the NGX All Share Index (ASI) settling at 150,573.87. Market sentiment was notably bearish, as decliners (41) nearly doubled advancers (22), reflected in a market breadth of 0.54x. Despite the pullback, year-to-date returns remain a vibrant +45.40%, emphasizing the market’s impressive resilience this year. Trading activity was robust, with total volume traded at 513.10M shares (up from the previous day), and turnover climbing 3.85% to ₦14.89B.
Market Breadth & Participation
- Bearish breadth: Only 22 stocks advanced versus 41 decliners, suggesting a broad-based selloff with some bargain-hunting in select names.
- Volume Movement: Trade volume increased for 57 companies and declined for 84—highlighting rotation into specific, mostly high-conviction plays.
- Turnover: The steady rise in turnover despite negative price action suggests institutional positioning—potentially rebalancing or profit-taking into market strength.
Top Gainers & Losers - Daily Movers
| Symbol | Stock Name | Close | % Change | RSI | MACD | 15DMA/50DMA Cross |
|---|---|---|---|---|---|---|
| GREENWETF | GREENWICH ASSET ETF | 385.00 | +10.00% | 50.48 | 16.46 (bullish) | Above |
| UPDC | UPDC PLC | 6.59 | +9.83% | 42.38 | -0.06 (flat) | Above |
| FCMB | FCMB GROUP PLC. | 10.80 | +8.00% | 40.32 | -0.05 (neutral) | Above |
| OMATEK | OMATEK VENTURES PLC | 1.30 | +7.44% | 41.13 | -0.00 (sideways) | N/A |
| STANBICETF30 | STANBIC IBTC ETF 30 | 550.00 | +5.77% | 54.88 | 13.03 (bullish) | Above |
| LEGENDINT | LEGEND INTERNET PLC | 5.26 | -9.93% | 53.34 | 0.01 (neutral) | Below |
| CHAMPION | CHAMPION BREW. PLC. | 14.40 | -9.72% | 51.79 | -0.04 (slightly bearish) | Below |
| TANTALIZER | TANTALIZERS PLC | 2.15 | -8.12% | 48.30 | -0.01 | N/A |
| SOVRENINS | SOVEREIGN TRUST INS. | 3.08 | -7.51% | 44.74 | 0.19 (bullish divergence) | Below |
| LINKASSURE | LINKAGE ASSURANCE PLC | 1.85 | -7.50% | 50.01 | -0.03 (slight weakness) | Below |
- Biggest climber: GREENWETF (+10.00%) showed robust technical momentum (healthy MACD, strong positive close above both its 15 and 50DMA) – ETF demand appears resilient.
- Headline loser: LEGENDINT (-9.93%) led the declines, closely trailed by CHAMPION (-9.72%). Notably, SOVRENINS and LINKASSURE both remain under notable technical stress, with negative price/volume trends and technical breakdowns below moving averages.
- Several top gainers (FCMB, GREENWETF, STANBICETF30) also register among stocks with unusual volume, suggesting institutional or smart money involvement.
Significant Trends & Patterns
- Turnover & Volume Uptrend: Despite a net market loss, both turnover and traded volume increased, hinting at active institutional repositioning and potential accumulation in select pockets.
-
Unusual Volume Highlights:
- FCMB (314.78% of 90DAvg)—Price jumped +8.0%, breached the 15DMA, and saw heavy inflows from institutions (139M units). Momentum and volume signals converge bullishly here.
- GUINNESS (1185% of 90DAvg)—Despite a price dip (-3.41%), massive volume may signal a shakeout or block trades; watch for reversal or follow-through.
- CONHALLPLC (+311%) and PZ (+143%)—both posted significant volume spikes, signalling possible re-rating or position building.
-
Bullish Momentum Leaders:
- Strong 15DMA breakouts in FCMB, HONYFLOUR, STANBIC, UNILEVER
- Several ETFs (LOTUSHAL15, STANBICETF30) also produced strong buy signals, aiding sector-wide ETF flows.
-
Bearish Momentum Laggards:
- ETI, BERGER, STERLINGNG, CHAMPION, LEGENDINT all triggered 15DMA breakdowns and may see further pressure if volumes persist.
- LINKASSURE notable for simultaneous price weakness and a breakdown below both short- and long-term moving averages.
Year-to-Date (YTD) – Gainers & Losers
| Symbol | Name | Price | YTD % | 5D % | Div. Yield | RSI |
|---|---|---|---|---|---|---|
| HONYFLOUR | HONEYWELL FLOUR MILL PLC | 20.90 | +216.47% | +21.67% | 1.40 | 46.01 |
| NCR | NCR (NIGERIA) PLC. | 17.60 | +220.00% | +10.00% | 0.00 | 84.79 |
| EUNISELL | EUNISELL INTERLINKED PLC | 64.90 | +236.79% | +10.00% | 0.00 | 80.33 |
| UPDC | UPDC PLC | 6.00 | +280.92% | +7.15% | 0.00 | 42.38 |
| GREENWETF | GREENWICH ASSET ETF | 350.00 | +65.80% | +8.45% | 0.00 | 50.48 |
| Symbol | Name | Price | YTD % | 5D % | Div. Yield | RSI |
|---|---|---|---|---|---|---|
| SOVRENINS | SOVEREIGN TRUST INSURANCE PLC | 3.33 | -20.62% | -7.51% | 3.75 | 44.74 |
| SKYAVN | SKYWAY AVIATION HANDLING CO. | 80.60 | -18.99% | 0.00% | 1.15 | 27.79 |
| OANDO | OANDO PLC | 42.00 | -13.63% | -1.19% | 1.15 | 42.67 |
| ELLAHLAKES | ELLAH LAKES PLC. | 11.36 | -11.43% | -4.49% | 0.00 | 34.92 |
| ASOSAVINGS | ASO SAVINGS AND LOANS | 0.96 | -12.15% | -2.08% | 10.00 | 75.61 |
- Overlap Note: GREENWETF, FCMB, and STANBICETF30 are represented in both the top daily gainers and the bullish momentum table, reinforcing technical strength.
- Downside Continuation Risk: Multiple names from the YTD loser table, such as SOVRENINS, also appear among the day's decliners and in the bearish momentum list. This underscores weak hands and continued pressure—avoid attempting to catch falling knives.
Bullish & Bearish Momentum Tables – Key Insights
-
Bullish breakouts:
- FCMB—Confirmed with unusual volume and price breakout above 15DMA; MACD still neutral but positioning is strong.
- HONYFLOUR and STANBICETF30—Consistent with YTD outperformance, these signals may draw more trend-followers.
-
Bearish signals:
- CHAMPION: Broke below both 15DMA and hit the day's losers list. RSI not yet oversold, so further caution warranted.
- LEGENDINT and LINKASSURE: Downward break suggests shorts or further de-risking may occur soon.
- No extreme RSI divergences (no stocks above RSI 70 or below 30 in these lists today), but several are near critical levels. Monitor for reversals.
Contrarian Signals
- FCMB: Despite momentum and unusual volume, its RSI sits at 40.32 (not overbought), suggesting further upside may be available if macro/sector sentiment holds.
- CHAMPION: Down -9.72% YTD yet MACD is not deeply negative (-0.04), and RSI is mid-band (51.8). If negative momentum fades, this could set up for a short-term technical bounce.
- SOVRENINS: Appears on both YTD and daily loser tables, but shows a positive MACD histogram, hinting at a possible reversal if volume and sentiment improve.
Sector Heatmap
| Sector | Top Performer | Indicative Move | Volume Spike? | Technical Trend |
|---|---|---|---|---|
| Other Financials | FCMB | +8.0% | Double volume | Bullish crossover |
| ETF | GREENWETF, STANBICETF30 | +10.0% / +5.77% | No | Multi-signal bullish |
| Beverages | CHAMPION | -9.72% | No | Bearish breakdown |
| Food Products | HONYFLOUR | +4.57% | No | Momentum break |
| Insurance | SOVRENINS, LINKASSURE | -7.51% / -7.50% | No significant volume | Weak undercurrents |
Dividend–Beta Matrix
| Symbol | Div. Yield (%) | Beta | Volatility | Comment |
|---|---|---|---|---|
| SOVRENINS | 3.75 | 1.12 | 1.03 | High yield, but high risk |
| LINKASSURE | 5.56 | 0.41 | 0.50 | Defensive with yield, but technicals weak |
| FCMB | 5.62 | 1.17 | 0.29 | Yield, risk, & momentum aligned |
| HONYFLOUR | 1.40 | 0.99 | 0.82 | Moderate yield, moderate risk |
| STANBIC | 3.54 | 0.22 | — | Defensive with upward momentum |
Institutional Clustering & Trade Patterns
- ZENITHBANK: Led institutional activity, absorbing 6.4% of total institutional volume and 14.4% of value. Such clustering typically signals major rebalancing or strategic positioning.
- FCMB: Featured in both institutional and retail top trades, further affirming its dominant liquidity and investor interest for the day.
-
Market Breakdown:
- Institutional investors accounted for 36.07% of trades but a commanding 77.90% of volume and 89.24% of value. Their trades—especially in heavy banking names—drove broader market flows and may lead to aftershocks in coming sessions.
- Retail trades were 63.93% by count but only 22.10% of volume, indicating institutions are steering direction while retail chases moves.
| Top 5 Institutional Trades by Volume | |
|---|---|
| Symbol | Volume |
| ZENITHBANK | 39.64M |
| FCMB | 139.25M |
| ACCESSCORP | 28.74M |
| FIRSTHOLDCO | 19.72M |
| ARADEL | 0.69M |
| Top 5 Retail Trades by Volume | |
|---|---|
| Symbol | Volume |
| FCMB | 10.74M |
| ZENITHBANK | 2.24M |
| ACCESSCORP | 3.59M |
| MTNN | 0.23M |
| GTCO | 0.91M |
High Dividend Yield – Bullish & Bearish Implications
- SOVRENINS and LINKASSURE offer high yields, but appear in the bearish table—caution advised; dividend traps are possible.
- FCMB is rare for aligning high yield with both bullish technicals and large volume—a focus for momentum- and income-seeking portfolio managers.
Currency Market Note
The Naira edged lower by -0.02% to 1,442/USD. Forex pressure may weigh on foreign holdings and repatriation-sensitive equities. Keep an eye on importers and dollar earners.
Actionable Insights & Suggestions
- Bullish Opportunities: FCMB and GREENWETF are showing synchronized momentum, unusual volume, and improving institutional interest—prime watch-list additions.
- Caution Zones: CHAMPION, LEGENDINT, and SOVRENINS remain in multi-frame technical breakdown. Defensive investors should stay clear unless reversal signals appear.
- Defensive Play: Seek out defensive, high-yield, low-beta names but only after confirming technical stabilization (especially LINKASSURE, STANBIC).
- Swing trade setups: Names with both institutional flow and unusual volume (FCMB, ZENITHBANK) could provide high-liquidity entries for active traders.
Bottom Line: While short-term breadth signals caution, underlying signals in select momentum names (especially with heavy institutional and unusual volume) offer actionable trade set-ups for nimble bulls. Defensive yield hunters must avoid technical traps and instead stagger entries after technical signals reset.
|
Top ASI Gainers Over Last 5 Trading Days
|
Top ASI Losers Over Last 5 Trading Days
|
For more detailed analysis, on InfoWARE Market Data Terminal <NSEPERF> <GO>
On InfoWARE Finance Mobile App (Android, iPhone & iPad, Windows Phone and Windows 8/10), "Top Gainers & Losers"
GREENWICH ASSET ETF (GREENWETF) topped the advancers list closing at N385.00 with a gain of 10.00% followed by UPDC PLC (UPDC) which closed at N6.59 with a gain of 9.83%.
On the flip side LEGEND INTERNET PLC (LEGENDINT) and CHAMPION BREW. PLC. (CHAMPION) topped the decliners log with a loss of -9.93% at a close of N5.26, and -9.72% to close the day at N14.40 respectively.
| Symbol | LClose | %Chg |
|---|---|---|
| GREENWETF | 385.00 | 10.00 |
| UPDC | 6.59 | 9.83 |
| LOTUSHAL15 | 85.00 | 9.49 |
| FCMB | 10.80 | 8.00 |
| OMATEK | 1.30 | 7.44 |
| Symbol | LClose | %Chg |
|---|---|---|
| LEGENDINT | 5.26 | -9.93 |
| CHAMPION | 14.40 | -9.72 |
| TANTALIZER | 2.15 | -8.12 |
| SOVRENINS | 3.08 | -7.51 |
| LINKASSURE | 1.85 | -7.50 |
For more detailed analysis,
- On InfoWARE Market Data Terminal <TOPG> <GO>
- On InfoWARE Finance Mobile App ( Android, iPhone & iPad and Windows 10) , "Top Gainers & Losers"
Currency Market
In the currency market, the Naira fell 0.02%(-0.33) against the Dollar to settle at 1 to 1NSE: Bull Signal - Price crossed above 15 Day MA
This signal implies these stocks are under buying pressure and the price might continue to rise and therefore positions should be monitored closely. Further suggested analysis include looking at the overall market (ASI) to see if the uptrend is market wide, sector wide or specific to the stock. Portfolio managers tend to use this as a signal to do more research to add to their positions or lock in some profits. Typically further analysis should be done using commands like PC and RV on the InfoWARE Market Data Terminal. Another command is ALERTS to set price triggers for possible exit or entry as necessary
For more detailed analysis,
- On InfoWARE Market Data Terminal <NSEPERF> <GO>
- On InfoWARE Finance Mobile App ( Android , iPhone & iPad and Windows 10) , "Top Gainers & Losers"
| Symbol | Price | %Chg | 15DMA | PE | EPS | DivY | MktCap | Vol | Trades | Value | LstTradeTime |
|---|---|---|---|---|---|---|---|---|---|---|---|
| LOTUSHAL15 | 85.00 | 8.67 | 77.20 | 0.00 | 0.00 | 4.73K | 11.00 | 402.49K | 06-Nov-2025 14:31:13.877 | ||
| FCMB | 10.80 | 7.41 | 10.56 | 104.31 | 0.09 | 5.62 | 213.87B | 149.99M | 1,473.00 | 1.60B | 06-Nov-2025 14:30:16.983 |
| STANBICETF30 | 550.00 | 5.46 | 522.33 | 0.00 | 0.00 | 1.32K | 36.00 | 726.51K | 06-Nov-2025 14:31:03.350 | ||
| HONYFLOUR | 21.90 | 4.57 | 21.77 | 16.28 | 0.31 | 1.40 | 173.67B | 6.46M | 419.00 | 138.41M | 06-Nov-2025 14:30:17.547 |
| UNILEVER | 75.00 | 1.73 | 74.61 | 67.09 | 0.40 | 2.81 | 430.88B | 433.24K | 105.00 | 32.38M | 06-Nov-2025 14:30:20.797 |
| STANBIC | 112.35 | 0.00 | 112.31 | 6.87 | 8.23 | 3.54 | 1,455.72B | 449.45K | 196.00 | 50.22M | 06-Nov-2025 14:30:20.063 |
NSE: BEAR Signal - Price crossed below 15 Day MA
This signal implies these stocks are under selling pressure and the price might continue to slide and therefore positions should be monitored closely. Further suggested analysis include looking at the overall market (ASI) to see if the downtrend is market wide, sector wide or specific to the stock. If the overal market trend is upwards, then since these stocks are heading in the opposite direction, then further analysis should be done using commands like PC and RV on the InfoWARE Market Data Terminal. Another command is ALERTS to set price triggers for possible exit is necessar
For more detailed analysis,
- On InfoWARE Market Data Terminal <BEARM> <GO>
- On InfoWARE Finance Mobile App ( Android , iPhone & iPad and Windows 10)
| Symbol | Price | %Chg | 15DMA | PE | EPS | DivY | MktCap | Vol | Trades | Value | LstTradeTime |
|---|---|---|---|---|---|---|---|---|---|---|---|
| UNIVINSURE | 1.15 | -1.74 | 1.17 | 0.00 | 0.00 | 0.00 | 18.40B | 2.78M | 63.00 | 3.20M | 06-Nov-2025 14:30:20.887 |
| ETI | 36.00 | -4.17 | 37.16 | 5.00 | 5.10 | 2.00 | 660.58B | 1.67M | 83.00 | 61.22M | 06-Nov-2025 14:30:16.837 |
| BERGER | 39.00 | -5.13 | 39.66 | 14.18 | 1.22 | 1.15 | 11.30B | 415.99K | 84.00 | 15.98M | 06-Nov-2025 14:30:15.280 |
| STERLINGNG | 7.50 | -5.33 | 7.82 | 15.75 | 0.30 | 3.19 | 215.93B | 38.50M | 440.00 | 314.97M | 06-Nov-2025 14:30:20.093 |
| NEWGOLD | 51,500.02 | -6.80 | 54,440.67 | 0.00 | 0.00 | 0.00 | 0.00 | 21.00 | 8.00 | 1.08M | 06-Nov-2025 14:31:03.210 |
| VETGRIF30 | 55.00 | -8.00 | 55.93 | 0.00 | 0.00 | 2.96K | 14.00 | 189.98K | 06-Nov-2025 14:31:03.650 | ||
| LINKASSURE | 1.85 | -8.11 | 1.97 | 59.89 | 0.02 | 5.56 | 25.90B | 1.56M | 43.00 | 2.85M | 06-Nov-2025 14:30:18.117 |
| CHAMPION | 14.40 | -10.76 | 15.49 | 412.83 | 0.01 | 0.41 | 112.74B | 522.60K | 75.00 | 7.53M | 06-Nov-2025 14:30:15.767 |
| LEGENDINT | 5.26 | -11.03 | 5.77 | 0.00 | 0.00 | 650.03K | 63.00 | 3.55M | 06-Nov-2025 14:30:18.090 |
Market Trend - ASI (NGX All-Share-Index) With 50 & 200 Day MAvgs Chart
Technical traders typically use the 50 & 200 day moving averages to aid in choosing
where to enter or exit a position, which then causes these levels to act as strong
support or resistance. As a general guideline, if the price is above a moving average,
the trend is up. If the price is below a moving average, the trend is down.
It is important to note that critics of technical analysis say that moving averages act
as support and resistance because so many traders use these indicators to inform their
trading decisions. Also moving averages tend to work quite well in strong trending conditions
but poorly in choppy or ranging conditions.
Trading Strategies: Crossovers
Crossovers are one of the main moving average strategies. The first type is a price crossover,
which is when the price crosses above or below a moving average to signal a potential change
in trend. Another strategy is to apply two moving averages to a chart: one longer and one
shorter. When the shorter-term MA crosses above the longer-term MA, it is a buy signal, as
it indicates that the trend is shifting up. This is known as a golden cross. Meanwhile, when
the shorter-term MA crosses below the longer-term MA, it is a sell signal, as it indicates that
the trend is shifting down. This is known as a dead/death cross
For more detailed analysis,
- On InfoWARE Market Data Terminal <CI> <GO>
- On InfoWARE Finance Mobile App ( Android , iPhone & iPad and Windows 10) , "Research"
Unusual Volume: Volume traded is more than double the 90 day moving average (All exchanges; ASI & ASem). For more detailed analysis,
- On InfoWARE Market Data Terminal <UV> <GO>
- On InfoWARE Finance Mobile App ( Android , iPhone & iPad and Windows 10)
| Symbol | Name | Volume | 90DAvgVol | %VolChg | Price | LClose | %Chg | Trades | Value |
|---|---|---|---|---|---|---|---|---|---|
| FCMB | FCMB GROUP PLC. | 149.99M | 36.16M | 314.78 | 10.80 | 10.00 | 8.00 | 1,473 | 1.60B |
| CONHALLPLC | CONSOLIDATED HALLMARK INSURANCE PLC | 79.09M | 19.21M | 311.62 | 4.09 | 4.04 | 1.24 | 50 | 319.72M |
| ASOSAVINGS | ASO SAVINGS AND LOANS PLC | 13.27M | 6.03M | 120.15 | 0.94 | 0.96 | -2.08 | 284 | 12.26M |
| GUINNESS | GUINNESS NIG PLC | 9.45M | 735.59K | 1,185.18 | 170.00 | 176.00 | -3.41 | 121 | 1.60B |
| PZ | P Z CUSSONS NIGERIA PLC. | 8.08M | 3.32M | 143.27 | 39.50 | 39.50 | 0.00 | 378 | 319.11M |
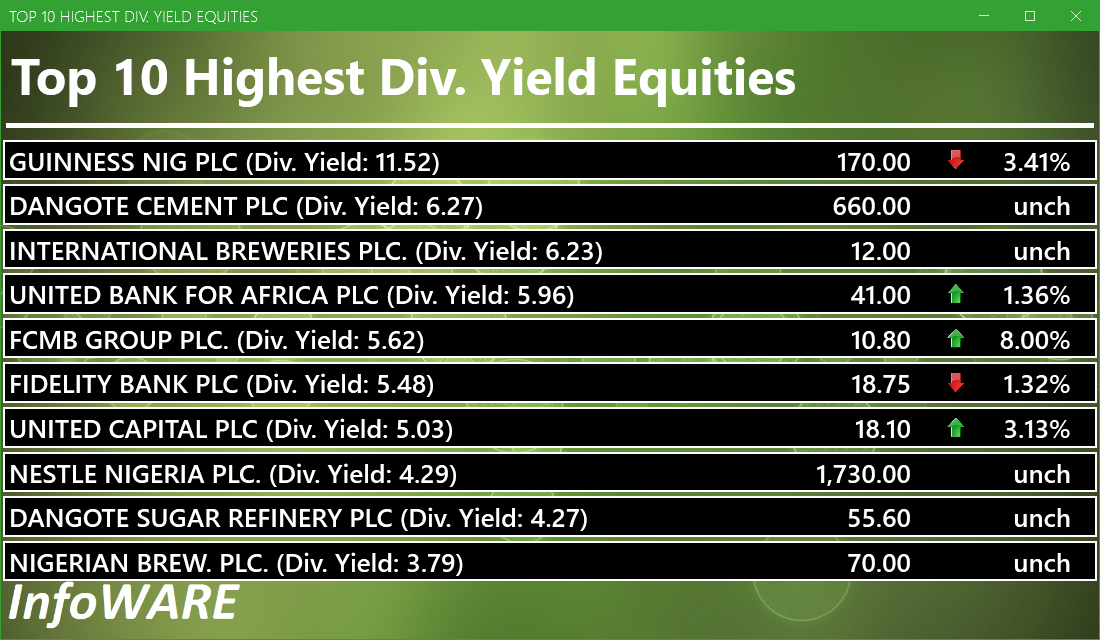
Investment Insights - High Div. Stocks
Dividend stocks distribute a portion of the company earnings to investors on a regular basis and they can a great choice for investors looking for regular income. As an investment or trading strategy, high dividend yield equities provide annual cash payments as against mostly capital gains in the price of a stock. The list in the table below represent the highest dividend paying stocks from the list of the most liquid stocks in the NSE top 30.
For more detailed analysis,
- On InfoWARE Market Data Terminal <HYIELD> <GO>
- On InfoWARE Finance Mobile App ( Android , iPhone & iPad and Windows 10) , "Research"
African Markets
| Name | LClose | Change | %Chg |
|---|---|---|---|
| BRVM Stock Exchange | 334.57 | -2.63 | -0.78 |
| Botswana Stock Exchange | 10,581.70 | 4.23 | 0.04 |
| Egyptian Exchange | 39,132.25 | 66.41 | 0.17 |
| Ghana Stock Exchange | 8,282.26 | -1.66 | -0.02 |
| Johannesburg Stock Exchange | 108,795.90 | 1,417.40 | 1.32 |
| Lusaka Stock Exchange | 25,383.15 | -15.24 | -0.06 |
| Casablanca Stock Exchange | 19,406.21 | -156.50 | -0.80 |
| Malawi Stock Exchange | 613,978.84 | -61.40 | -0.01 |
| Nigeria Stock Exchange | 150,573.87 | -2,060.56 | -1.35 |
| Nairobi Securities Exchange | 189.88 | 0.79 | 0.42 |
| Namibian Stock Exchange | 1,972.80 | 13.32 | 0.68 |
| Rwanda Stock Exchange | 179.09 | 0.00 | 0.00 |
| Tunis Stock Exchange | 12,681.19 | 25.31 | 0.20 |
| Uganda Securities Exchange | 1,558.39 | 23.03 | 1.50 |
Nigeria Market Indexes
| Symbol | LClose | %Chg | WTD% | MTD% | QTD% | YTD% | MktCap | Trades |
|---|---|---|---|---|---|---|---|---|
| ASI | 150,026.55 | -0.36 | -2.41 | -2.41 | 4.93 | 45.40 | 23,224 | |
| NGX30 | 5,499.10 | -0.34 | -2.46 | -2.46 | 5.39 | 44.15 | 13,797 | |
| NGXAFRBVI | 3,211.95 | -0.63 | -3.21 | -3.21 | -9.51 | 29.47 | 5,047 | |
| NGXAFRHDYI | 21,046.82 | 0.13 | -3.44 | -3.44 | -5.45 | 23.60 | 6,612 | |
| NGXASEM | 1,392.88 | 0.00 | 0.00 | 0.00 | -9.44 | -12.05 | 2 | |
| NGXBNK | 1,422.39 | -0.56 | -2.79 | -2.79 | -6.22 | 30.80 | 5,314 | |
| NGXCG | 3,947.94 | -0.69 | -3.42 | -3.42 | -2.54 | 39.54 | 12,399 | |
| NGXCNSMRGDS | 3,460.83 | -0.06 | -2.56 | -2.56 | 2.31 | 99.55 | 3,063 | |
| NGXCOMMDTY | 1,210.42 | 0.00 | 0.22 | 0.22 | 7.90 | 21.04 | ||
| NGXGROWTH | 15,547.44 | -0.38 | 0.25 | 0.25 | 3.15 | 100.28 | 301 | |
| NGXINDUSTR | 5,897.38 | 0.20 | -0.98 | -0.98 | 16.37 | 65.12 | 1,902 | |
| NGXINS | 1,163.10 | -0.28 | -4.11 | -4.11 | -2.76 | 47.94 | 1,382 | |
| NGXLOTUSISLM | 13,279.47 | -0.37 | -2.44 | -2.44 | 11.86 | 90.58 | 4,514 | |
| NGXMAINBOARD | 7,193.06 | -0.13 | -1.85 | -1.85 | 2.11 | 43.75 | 16,305 | |
| NGXMERIGRW | 10,117.70 | 0.95 | -1.96 | -1.96 | 2.17 | 55.10 | 3,345 | |
| NGXMERIVAL | 12,724.14 | -0.35 | -2.35 | -2.35 | -4.82 | 21.99 | 7,251 | |
| NGXOILGAS | 2,779.91 | -0.08 | -0.65 | -0.65 | 10.05 | 2.54 | 382 | |
| NGXPENBRD | 2,812.49 | -0.37 | -2.05 | -2.05 | 6.09 | 53.55 | 19,455 | |
| NGXPENSION | 6,767.69 | -0.45 | -2.68 | -2.68 | 0.44 | 49.26 | 15,489 | |
| NGXPREMIUM | 15,165.25 | -0.79 | -3.47 | -3.47 | 10.76 | 55.81 | 6,618 | |
| NGXSOVBND | 668.40 | 0.00 | 0.00 | 0.00 | 1.69 | 11.11 | 0 |
For more detailed analysis,
- On InfoWARE Market Data Terminal <MKTINS> <GO>
- On InfoWARE Finance Mobile App ( Android, iPhone & iPad and Windows 10) , "Market Indexes"
Find the topic interesting? Will like to comment? Contact Us at solutions@infowarelimited.com
Top News

Chart Of The Day - ASI Chart Vs ASI Advance Decline Line (YTD) (06-Nov-2025 15:08:19.029)
InfoWARE AI Analyst Daily Market Report: 06-Nov-2025

[XNSA]>> APPOINTMENT OF DIRECTORS
[XNSA]>> DAILY FUND PRICE SUBMISSION - FCMB ASSET MANAGEMENT LIMITED
[VSPBONDETF]>> DAILY INDICATIVE PRICES
[XNSA]>> CORDROS MILESTONE FUNDS' BID & OFFER PRICES
[XNSA]>> NGX FIXED INCOME INDICATIVE PRICE LIST FOR NOV 06, 2025
[LOTUSHAL15]>> DAILY INDICATIVE PRICES
[XNSA]>> H2 2025 BC/DR TEST
[XNSA]>> AELP CAPACITY BUILDING & ASSDA FORUM
[STANBICETF30]>> DAILY INDICATIVE PRICES
Chart Of The Day - ASI Chart Vs ASI Advance Decline Line (YTD) (05-Nov-2025 15:08:47.129)
InfoWARE AI Analyst Daily Market Report: 05-Nov-2025
[XNSA]>> OFF MARKET TRADE
[VSPBONDETF]>> DAILY INDICATIVE PRICES
[LOTUSHAL15]>> DAILY INDICATIVE PRICES
[XNSA]>> CORDROS MILESTONE FUNDS' BID & OFFER PRICES
[XNSA]>> NGX FIXED INCOME INDICATIVE PRICE LIST FOR NOV 05, 2025
[XNSA]>> H2 2025 BC/DR TEST
[XNSA]>> AELP CAPACITY BUILDING & ASSDA FORUM
[XNSA]>> NOTIFICATION OF PRICE ADJUSTMENT
Chart Of The Day - ASI Chart Vs ASI Advance Decline Line (YTD) (04-Nov-2025 15:07:17.787)
InfoWARE AI Analyst Daily Market Report: 04-Nov-2025
[VSPBONDETF]>> DAILY INDICAIVE PRICES
[LOTUSHAL15]>> DAILY INDICATIVE PRICES
[XNSA]>> CORDROS MILESTONE FUNDS' BID & OFFER PRICES
[XNSA]>> NGX FIXED INCOME INDICATIVE PRICE LIST FOR NOV 04, 2025
[XNSA]>> H2 2025 BC/DR TEST
[XNSA]>> AELP CAPACITY BUILDING & ASSDA FORUM
[XNSA]>> SUPPLEMENTARY LISTINGS
Get IDIA - the stock trading app for the modern investor
Solutions by Business
Product Suites
Company
Contacts
- 8th Floor,
- South Atlantic Petroleum Towers,
- 1 Adeola Odeku Street,
- Victoria Island,
- Lagos, Nigeria.
- Email: solutions@infowarelimited.com
Follow Us
 |
 |
 |
 |