


InfoWARE AI Analyst Daily Market Report: 11-Dec-2025 | InfoWARE Finance
Get IDIA - the stock trading app for the modern investor


InfoWARE AI Analyst Daily Market Report: 11-Dec-2025
(Source: InfoWARE Terminal, Date: 11-Dec-2025)
Dear Investor,
NGX Daily Market Roundup – Thursday, December 11, 2025
The NGX All Share Index (ASI) rebounded today, climbing +0.74% to close at 146,862.01, while YTD returns remain a robust +43.39%. Market breadth favored advancers with a ratio of 1.24x: 36 gainers versus 29 losers. Despite the bullish tilt, overall market volume slipped to 503.27 million shares (from 661.12 million yesterday), and turnover eased by -1.96% to 11.24 billion Naira. ETF volatility took the spotlight, with NEWGOLD ETF soaring +10.37% and MERGROWTH ETF dropping -10.00%. Noteworthy, a clear bifurcation in institutional activity dominated value and volume, hinting at selective accumulation and sector rotations playing out beneath the surface. Let’s break down the day’s key moves and hidden trends.
Market Breadth & Trends
- Breadth: With 36 advancers edging out 29 decliners and a breadth of 1.24x, bullish sentiment remains intact but is moderating from recent peaks.
- Volume Divergence: 65 stocks saw volume upticks while 76 declined; yet, total volume dropped -24% day-over-day, underscoring a rotation from high-flying names into selective buying.
- Turnover Dip: Market value traded slipped -1.96%, typically a cautionary sign — investors may be pausing after recent strong gains.
- Institutional Command: Institutions captured 76% of traded volume and 88.8% of value with just 36.6% of total trades, reflecting high-conviction block trading in select bellwethers.
Day’s Top Gainers & Losers
| Stock | % Change | RSI | MACD | Notes |
|---|---|---|---|---|
| NEWGOLD ETF | +10.37% | 45.9 | -106.96 | Low RSI, breakout above 15DMA; ETF inflows on gold rally. |
| MERGROWTH ETF | +10.00% | 87.8 | +34.02 | Overbought (RSI >70), sharply positive MACD – possible profit-taking soon. |
| JAPAUL GOLD | +9.88% | 66.1 | -0.01 | Heavy volume surge (>2x avg), positive price momentum persists. |
| BERGER PAINTS | +9.88% | 47.2 | -0.45 | Momentum spike; low RSI and negative MACD hint at reversal risk if volume ebbs. |
| MORISON | +9.77% | 96.4 | +0.15 | Severely overbought (RSI 96.4), high momentum, but ripe for mean reversion/correction. |
| Stock | % Change | RSI | MACD | Notes |
|---|---|---|---|---|
| STANBICETF30 | -10.00% | 67.4 | +256.05 | Bearish price action even with strong MACD; possible divergence. |
| VETINDETF | -10.00% | 69.0 | +3.03 | High RSI, positive MACD, sell-off could be exhaustion move. |
| JOHNHOLT | -9.26% | 19.9 | -0.16 | Oversold; possible dead-cat bounce ahead if buying emerges. |
| CHAMPION BREW. | -7.86% | 48.6 | -0.20 | Persistent selling, but not in oversold territory yet. |
| VETBANK | -7.74% | 62.7 | -0.05 | Above-average RSI, drifting down, macro/bank sector drag. |
YTD Gainers & Losers: Contrasts & Table
| Stock | YTD % | 5D % | RSI | Notes |
|---|---|---|---|---|
| MERGROWTH | +68.7% | +33.1% | 87.78 | Steep multi-week rally; overbought, earnings/catalyst driven. |
| MECURE | +173% | +27.3% | 90.4 | High RSI, intense momentum, caution on profit-taking risk. |
| JAPAUL GOLD | +29.9% | +27.5% | 66.13 | Heavy volume, trending higher aggressively. |
| MERVALUE | +129.8% | +21.3% | 94.1 | Extreme momentum, eye for reversion, ETF flows. |
| SIAMLETF40 | +5.9% | +10.0% | 96.4 | RSI at 96.4, ETF-momentum likely unsustainable. |
| Stock | YTD % | 5D % | RSI | Notes |
|---|---|---|---|---|
| SUNUASSUR | -65.6% | -7.6% | 35.1 | Deep value trap? |
| JOHNHOLT | -37.1% | -9.3% | 19.9 | VERY oversold, potential for technical bounce. |
| UACN | -145.2% | -16.5% | 55.7 | Capital destruction continues. |
| CHAMPION | -238.6% | -7.9% | 48.6 | Trend still weak, modest RSI. |
| VETGRIF30 | -35.1% | -15.2% | 43.9 | ETF sector-wide drawdown. |
Bullish & Bearish Momentum Signals
- Bullish Crossovers: Stocks crossing above 15DMA include NEWGOLD, LEGENDINT, DAARCOMM, NEM, DANGSUGAR. Among them, DANGSUGAR stands out: RSI at mid-level, strong price, and >4% dividend yield.
- Bearish Crossovers: Notably, CHAMPION BREW. crossed below 15DMA (down -8.5%) – RSI 48.6, not yet oversold but momentum remains negative. Several fixed income ETFs/bonds also showed bearish cross.
- Unusual Volume Surges: ACCESSCORP (+225% volume), FCMB (+272%), JAPAUL GOLD (+111%) suggest heavy trading interest, often precursors to trend continuation or sharp reversals.
- Red-flag Overbought: MORISON (RSI 96.4) and MERGROWTH (87.8) are highly overbought – typically, such levels risk sharp snapback corrections. Profit protection strategies are advisable for existing holders.
- Bullish ETF Flows: Multiple ETFs (MERGROWTH, NEWGOLD, SIAMLETF40) show explosive moves and are overbought—watch for rebalancing & volatility risk.
- Oversold Bounce Watch: JOHNHOLT (RSI 19.9) may set up for a relief rally if buyers step in.
Contrarian Signals
- CHAMPION: Despite a neutral RSI (48.6) and bearish momentum crossing below 15DMA, MACD is improving versus signal. Down -7.9% YTD, this may signal an inflection (contrarian buy-the-dip?) if technicals firm up.
- JOHNHOLT: RSI of 19.9 (deeply oversold), significant YTD drawdown, but next upmove may be sharp if sentiment shifts.
- MERGROWTH: Extreme overbought on RSI yet continues to attract flows. Momentum can persist, but prudent watch for reversal signals.
- STANBICETF30: Despite strong MACD, price fell -10% (top loser); divergence suggests current weakness may find support soon, especially given robust YTD gains.
Sector Heatmap
| Sector | Top Mover | Trend | Institutional Activity* |
|---|---|---|---|
| Banking | ACCESSCORP | Bullish, heavy volume | ZENITHBANK (20.17% of institutional value) |
| Insurance | NEM | Bullish, above 15DMA | Low, but pockets in NEM |
| ETFs | MERGROWTH | Momentum overbought | Sharp flows |
| Food Prod. | DANGSUGAR | Breakout | Modest |
| Media | DAARCOMM | Bullish | Weak |
| Telecom | MTNN | Steady | Consistent blue-chip flows |
Dividend-Beta Matrix: Defensive Picks
| Stock | Dividend Yield | Beta | Analysis |
|---|---|---|---|
| DANGSUGAR | 4.27% | 1.35 | Solid yield, moderate beta; good for combining defensive income with growth exposure. |
| NEM | 6.52% | 0.69 | Attractive income, lower volatility play. Bullish crossover reinforces. |
| LIVESTOCK | 2.94% | 0.46 | Yield with limited risk, but sector cyclical. |
| GUINEAINS | 1.96% | 1.51 | High yield, but higher beta exposes to swings. |
Institutional Clustering & Trade Flow Insights
- ZENITHBANK garnered 20.17% of institutional trade value, a sign of heavy positioning by large players in banking. These are often leading indicators for the rest of the sector.
- ACCESSCORP also had institutional flows accounting for nearly a quarter of institutional volume, with 225% spike in retail trading as well—a convergence which can reinforce short-term trend bursts.
- MTNN: Both retail and institutional interest; big block trades signal sustained blue-chip demand.
- Retail investors made up 63.4% of trades, but only 23.8% of volume. This spread often precedes volatility "whipsaws” as crowd flocks late to winners or cut losers.
Trade Summary & Activity Patterns
- Institutional to Retail Split: Institutions led value and volume (89% of value, 76% of volume), suggesting continued smart-money dominance, especially in ACCESSCORP, ZENITHBANK, and MTNN. For traders, following institutional flows often pays off in the near-term.
- Retail Activity: Retail’s focus was spread between top blue chips (MTNN, ACCESSCORP, ZENITHBANK, GTCO, UBA), but with much lower value per trade – caution for herding risk.
- Correlation Alert: Notable that stocks with high institutional and retail overlap (ACCESSCORP, ZENITHBANK) also saw volume surges and price leadership – often signals a "crowded trade” susceptible to sharp runs or reversals.
- Unusual Volume: JAPAULGOLD’s price/volume action could flag ongoing accumulation (or speculative flows) — supportive of further price surges in the short term.
Trader Takeaways & Opportunities
- Momentum Seekers: Consider trailing stops/profit harvests in overbought names (MERGROWTH, MORISON, MERVALUE, SIAMLETF40). Overheated RSI signals warrant caution.
- Bounce Hunters: Monitor JOHNHOLT and CHAMPION for possible mean-reversion rallies. Deeply oversold technicals can spark sharp reversals if positive news or flows emerge.
- Defensive Income: NEM, DANGSUGAR, and LIVESTOCK: Attractive yields with lower beta (market risk) profiles for those seeking stability amid volatility.
- Swing Traders: Watch stocks with both institutional and retail enthusiasm (ACCESSCORP, ZENITHBANK, MTNN); but beware of crowding signals.
- ETF Traders: Extreme momentum in ETF space suggests both opportunity and risk: tight stops, nimble exits recommended.
- Monitor Turnover: Market value turnover falling while prices rise can be an early warning for a coming pause or reversal.
- Sector Rebalancing: Look for spillover into lagging but fundamentally strong sectors as excesses in overbought ETFs and names correct.
|
Top ASI Gainers Over Last 5 Trading Days
|
Top ASI Losers Over Last 5 Trading Days
|
For more detailed analysis, on InfoWARE Market Data Terminal <NSEPERF> <GO>
On InfoWARE Finance Mobile App (Android, iPhone & iPad, Windows Phone and Windows 8/10), "Top Gainers & Losers"
NEWGOLD EXCHANGE TRADED FUND (ETF) (NEWGOLD) topped the advancers list closing at N58,500.00 with a gain of 10.37% followed by MERISTEM GROWTH EXCHANGE TRADED FUND (MERGROWTH) which closed at N665.62 with a gain of 10.00%.
On the flip side STANBIC IBTC ETF 30 (STANBICETF30) and VETIVA INDUSTRIAL ETF (VETINDETF) topped the decliners log with a loss of -10.00% at a close of N1,275.75, and -10.00% to close the day at N69.30 respectively.
| Symbol | LClose | %Chg |
|---|---|---|
| NEWGOLD | 58,500.00 | 10.37 |
| MERGROWTH | 665.62 | 10.00 |
| JAPAULGOLD | 2.78 | 9.88 |
| BERGER | 40.05 | 9.88 |
| MORISON | 4.27 | 9.77 |
| Symbol | LClose | %Chg |
|---|---|---|
| STANBICETF30 | 1,275.75 | -10.00 |
| VETINDETF | 69.30 | -10.00 |
| JOHNHOLT | 4.90 | -9.26 |
| CHAMPION | 12.90 | -7.86 |
| VETBANK | 14.30 | -7.74 |
For more detailed analysis,
- On InfoWARE Market Data Terminal <TOPG> <GO>
- On InfoWARE Finance Mobile App ( Android, iPhone & iPad and Windows 10) , "Top Gainers & Losers"
Currency Market
In the currency market, the Naira fell 0.01%(-0.18) against the Dollar to settle at 1 to 1NSE: Bull Signal - Price crossed above 15 Day MA
This signal implies these stocks are under buying pressure and the price might continue to rise and therefore positions should be monitored closely. Further suggested analysis include looking at the overall market (ASI) to see if the uptrend is market wide, sector wide or specific to the stock. Portfolio managers tend to use this as a signal to do more research to add to their positions or lock in some profits. Typically further analysis should be done using commands like PC and RV on the InfoWARE Market Data Terminal. Another command is ALERTS to set price triggers for possible exit or entry as necessary
For more detailed analysis,
- On InfoWARE Market Data Terminal <NSEPERF> <GO>
- On InfoWARE Finance Mobile App ( Android , iPhone & iPad and Windows 10) , "Top Gainers & Losers"
| Symbol | Price | %Chg | 15DMA | PE | EPS | DivY | MktCap | Vol | Trades | Value | LstTradeTime |
|---|---|---|---|---|---|---|---|---|---|---|---|
| NEWGOLD | 58,500.00 | 9.40 | 55,799.33 | 0.00 | 0.00 | 0.00 | 0.00 | 3.00 | 3.00 | 170.00K | 11-Dec-2025 14:32:44.067 |
| LEGENDINT | 5.50 | 8.18 | 5.26 | 0.00 | 0.00 | 618.14K | 42.00 | 3.37M | 11-Dec-2025 14:30:14.180 | ||
| DAARCOMM | 0.98 | 7.14 | 0.93 | 0.00 | 0.00 | 0.00 | 11.76B | 2.64M | 79.00 | 2.55M | 11-Dec-2025 14:30:13.523 |
| NEM | 26.65 | 6.19 | 25.92 | 24.99 | 0.37 | 6.52 | 133.69B | 1.54M | 99.00 | 39.73M | 11-Dec-2025 14:30:14.470 |
| DANGSUGAR | 57.50 | 5.57 | 55.23 | 11.48 | 3.06 | 4.27 | 698.45B | 2.11M | 422.00 | 118.28M | 11-Dec-2025 14:30:13.540 |
| EUNISELL | 83.40 | 4.08 | 80.73 | 0.00 | 0.00 | 0.31 | 19.74B | 472.67K | 129.00 | 36.88M | 11-Dec-2025 14:30:13.727 |
| LIVESTOCK | 6.30 | 3.97 | 6.22 | 0.00 | 0.00 | 2.94 | 18.90B | 307.71K | 57.00 | 1.94M | 11-Dec-2025 14:30:14.213 |
| GUINEAINS | 1.19 | 3.36 | 1.17 | 66.79 | 0.01 | 1.96 | 7.31B | 768.30K | 41.00 | 889.81K | 11-Dec-2025 14:30:13.920 |
| NGXINS | 1,130.30 | 2.90 | 1,096.12 | 10.41 | 2.09 | 0.00 | 0.00 | 45.56M | 1,133.00 | 147.70M | 11-Dec-2025 14:30:33.520 |
NSE: BEAR Signal - Price crossed below 15 Day MA
This signal implies these stocks are under selling pressure and the price might continue to slide and therefore positions should be monitored closely. Further suggested analysis include looking at the overall market (ASI) to see if the downtrend is market wide, sector wide or specific to the stock. If the overal market trend is upwards, then since these stocks are heading in the opposite direction, then further analysis should be done using commands like PC and RV on the InfoWARE Market Data Terminal. Another command is ALERTS to set price triggers for possible exit is necessar
For more detailed analysis,
- On InfoWARE Market Data Terminal <BEARM> <GO>
- On InfoWARE Finance Mobile App ( Android , iPhone & iPad and Windows 10)
| Symbol | Price | %Chg | 15DMA | PE | EPS | DivY | MktCap | Vol | Trades | Value | LstTradeTime |
|---|---|---|---|---|---|---|---|---|---|---|---|
| FG202029S5 | 110.93 | 0.00 | 110.93 | 0.00 | 0.00 | 0.00 | 0.00 | 0.00 | 11-Dec-2025 14:30:19.347 | ||
| FGSUK2033S6 | 100.00 | 0.00 | 100.02 | 0.00 | 0.00 | 1.08K | 3.00 | 1.08M | 11-Dec-2025 14:33:40.517 | ||
| NGXMERIGRW | 9,940.30 | -0.21 | 9,954.24 | 34.89 | 293.99 | 0.00 | 0.00 | 17.06M | 2,332.00 | 992.46M | 11-Dec-2025 14:30:34.383 |
| ELLAHLAKES | 13.10 | -1.91 | 13.33 | 0.00 | 0.00 | 0.00 | 26.20B | 4.70M | 357.00 | 61.97M | 11-Dec-2025 14:30:13.620 |
| TAJSUKS2 | 97.00 | -3.09 | 98.95 | 0.00 | 0.00 | 402.00 | 3.00 | 400.35K | 11-Dec-2025 14:33:41.810 | ||
| VFDGROUP | 10.30 | -5.34 | 10.38 | 0.00 | 0.00 | 0.00 | 0.00 | 2.01M | 123.00 | 20.87M | 11-Dec-2025 14:30:15.360 |
| CHAMPION | 12.90 | -8.53 | 13.66 | 412.83 | 0.01 | 0.41 | 101.00B | 1.09M | 120.00 | 14.47M | 11-Dec-2025 14:30:13.320 |
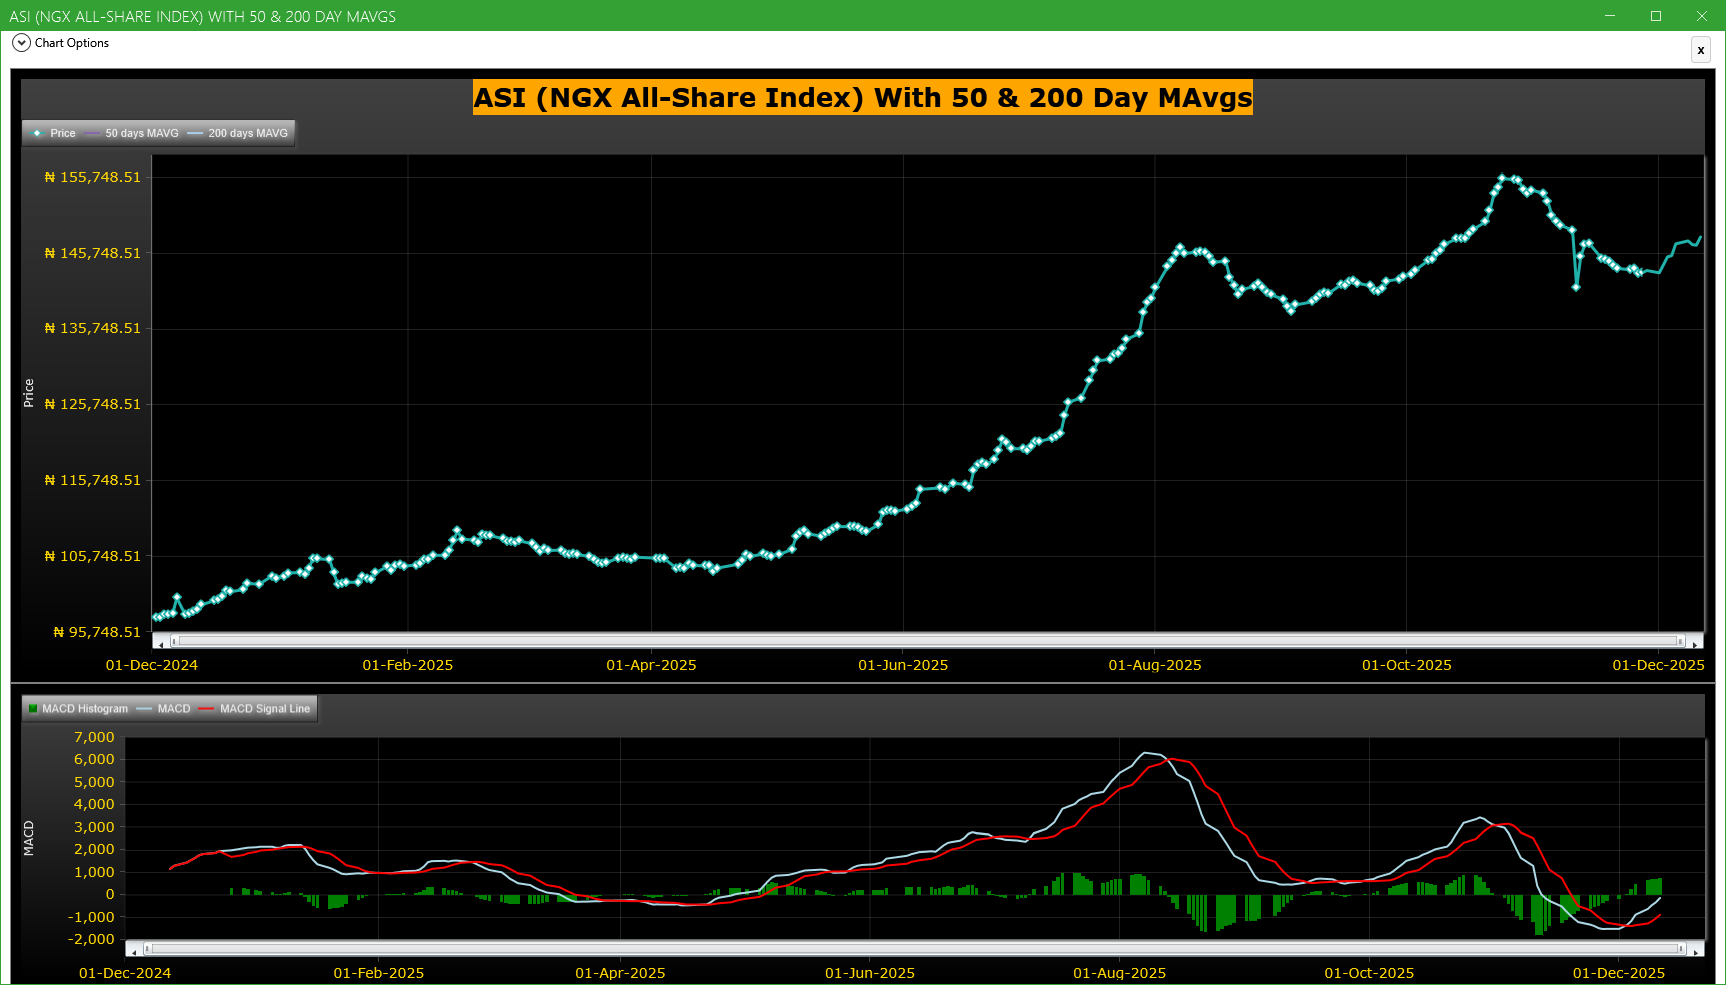
Market Trend - ASI (NGX All-Share-Index) With 50 & 200 Day MAvgs Chart
Technical traders typically use the 50 & 200 day moving averages to aid in choosing
where to enter or exit a position, which then causes these levels to act as strong
support or resistance. As a general guideline, if the price is above a moving average,
the trend is up. If the price is below a moving average, the trend is down.
It is important to note that critics of technical analysis say that moving averages act
as support and resistance because so many traders use these indicators to inform their
trading decisions. Also moving averages tend to work quite well in strong trending conditions
but poorly in choppy or ranging conditions.
Trading Strategies: Crossovers
Crossovers are one of the main moving average strategies. The first type is a price crossover,
which is when the price crosses above or below a moving average to signal a potential change
in trend. Another strategy is to apply two moving averages to a chart: one longer and one
shorter. When the shorter-term MA crosses above the longer-term MA, it is a buy signal, as
it indicates that the trend is shifting up. This is known as a golden cross. Meanwhile, when
the shorter-term MA crosses below the longer-term MA, it is a sell signal, as it indicates that
the trend is shifting down. This is known as a dead/death cross
For more detailed analysis,
- On InfoWARE Market Data Terminal <CI> <GO>
- On InfoWARE Finance Mobile App ( Android , iPhone & iPad and Windows 10) , "Research"
Unusual Volume: Volume traded is more than double the 90 day moving average (All exchanges; ASI & ASem). For more detailed analysis,
- On InfoWARE Market Data Terminal <UV> <GO>
- On InfoWARE Finance Mobile App ( Android , iPhone & iPad and Windows 10)
| Symbol | Name | Volume | 90DAvgVol | %VolChg | Price | LClose | %Chg | Trades | Value |
|---|---|---|---|---|---|---|---|---|---|
| ACCESSCORP | Access Holdings PLC | 156.32M | 48.11M | 224.90 | 20.20 | 20.30 | -0.49 | 1,084 | 3.16B |
| FCMB | FCMB GROUP PLC. | 74.54M | 20.05M | 271.85 | 11.00 | 11.00 | 0.00 | 357 | 819.50M |
| JAPAULGOLD | JAPAUL GOLD & VENTURES PLC | 41.15M | 19.52M | 110.79 | 2.78 | 2.53 | 9.88 | 385 | 105.99M |
| PRESTIGE | PRESTIGE ASSURANCE CO. PLC. | 6.96M | 3.01M | 131.12 | 1.70 | 1.63 | 4.29 | 95 | 11.80M |
| ETRANZACT | E-TRANZACT INTERNATIONAL PLC | 1.49M | 674.16K | 121.53 | 14.00 | 14.00 | 0.00 | 87 | 18.84M |
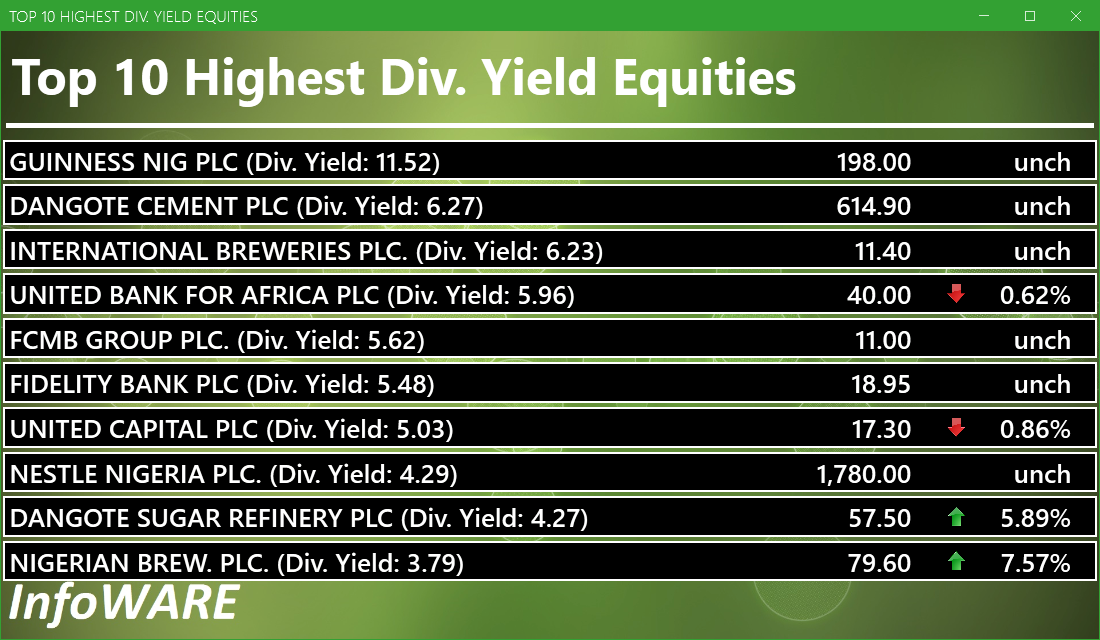
Investment Insights - High Div. Stocks
Dividend stocks distribute a portion of the company earnings to investors on a regular basis and they can a great choice for investors looking for regular income. As an investment or trading strategy, high dividend yield equities provide annual cash payments as against mostly capital gains in the price of a stock. The list in the table below represent the highest dividend paying stocks from the list of the most liquid stocks in the NSE top 30.
For more detailed analysis,
- On InfoWARE Market Data Terminal <HYIELD> <GO>
- On InfoWARE Finance Mobile App ( Android , iPhone & iPad and Windows 10) , "Research"
African Markets
| Name | LClose | Change | %Chg |
|---|---|---|---|
| BRVM Stock Exchange | 349.31 | -1.26 | -0.36 |
| Botswana Stock Exchange | 10,815.94 | 0.00 | 0.00 |
| Egyptian Exchange | 42,052.79 | 113.24 | 0.27 |
| Johannesburg Stock Exchange | 111,042.90 | 310.05 | 0.28 |
| Lusaka Stock Exchange | 25,547.25 | 237.91 | 0.94 |
| Casablanca Stock Exchange | 18,520.07 | 60.92 | 0.33 |
| Malawi Stock Exchange | 613,567.97 | 857.79 | 0.14 |
| Nigeria Stock Exchange | 146,862.00 | -73.47 | -0.05 |
| Nairobi Securities Exchange | 176.77 | -0.04 | -0.02 |
| Namibian Stock Exchange | 2,060.34 | 0.00 | 0.00 |
| Rwanda Stock Exchange | 180.95 | 0.07 | 0.04 |
| Uganda Securities Exchange | 1,511.24 | 5.42 | 0.36 |
Nigeria Market Indexes
| Symbol | LClose | %Chg | WTD% | MTD% | QTD% | YTD% | MktCap | Trades |
|---|---|---|---|---|---|---|---|---|
| ASI | 147,950.59 | 0.74 | 0.35 | 3.31 | 3.48 | 43.39 | 16,922 | |
| NGX30 | 5,415.01 | 0.74 | 0.44 | 3.40 | 3.78 | 41.95 | 9,091 | |
| NGXAFRBVI | 3,256.28 | -0.34 | -0.50 | 4.58 | -8.26 | 31.26 | 3,661 | |
| NGXAFRHDYI | 21,069.44 | -0.18 | -1.08 | 1.39 | -5.35 | 23.74 | 4,073 | |
| NGXASEM | 1,392.88 | 0.00 | 0.00 | 0.00 | -9.44 | -12.05 | 4 | |
| NGXBNK | 1,432.07 | -0.35 | -0.51 | 3.52 | -5.58 | 31.69 | 3,834 | |
| NGXCG | 4,007.05 | 0.95 | 0.69 | 4.38 | -1.08 | 41.63 | 8,860 | |
| NGXCNSMRGDS | 3,512.23 | 1.15 | 1.01 | 3.71 | 3.83 | 102.51 | 2,438 | |
| NGXCOMMDTY | 1,172.91 | 0.00 | -0.49 | -0.73 | 4.55 | 17.29 | ||
| NGXGROWTH | 17,967.20 | 6.37 | 21.35 | 21.53 | 19.21 | 131.45 | 249 | |
| NGXINDUSTR | 5,524.89 | 0.01 | -0.06 | 7.70 | 9.02 | 54.69 | 1,461 | |
| NGXINS | 1,130.30 | 2.99 | 1.02 | 4.29 | -5.50 | 43.77 | 1,133 | |
| NGXLOTUSISLM | 13,000.85 | 0.74 | -0.16 | 1.88 | 9.52 | 86.58 | 3,117 | |
| NGXMAINBOARD | 7,069.46 | 0.37 | -0.18 | 1.20 | 0.35 | 41.28 | 12,031 | |
| NGXMERIGRW | 9,940.30 | -0.21 | -1.77 | -0.23 | 0.37 | 52.38 | 2,332 | |
| NGXMERIVAL | 12,773.07 | -0.05 | -1.16 | 3.71 | -4.45 | 22.46 | 4,510 | |
| NGXOILGAS | 2,683.11 | -0.03 | -0.04 | -0.49 | 6.22 | -1.03 | 307 | |
| NGXPENBRD | 2,782.38 | 0.79 | 0.33 | 3.27 | 4.95 | 51.91 | 13,725 | |
| NGXPENSION | 6,818.35 | 0.66 | 0.17 | 2.98 | 1.20 | 50.38 | 10,271 | |
| NGXPREMIUM | 15,116.34 | 1.39 | 1.23 | 7.32 | 10.41 | 55.31 | 4,642 | |
| NGXSOVBND | 659.64 | 0.00 | -2.02 | -2.05 | 0.36 | 9.66 | 0 |
For more detailed analysis,
- On InfoWARE Market Data Terminal <MKTINS> <GO>
- On InfoWARE Finance Mobile App ( Android, iPhone & iPad and Windows 10) , "Market Indexes"
Find the topic interesting? Will like to comment? Contact Us at solutions@infowarelimited.com
Top News

Chart Of The Day - ASI Chart Vs ASI Advance Decline Line (YTD) (11-Dec-2025 15:10:32.891)
InfoWARE AI Analyst Daily Market Report: 11-Dec-2025

[XNSA]>> DAILY FUND PRICE SUBMISSION - FCMB ASSET MANAGEMENT LIMITED
[LOTUSHAL15]>> DAILY INDICATIVE PRICES
[VSPBONDETF]>> DAILY INDICATIVE PRICES
[XNSA]>> CORDROS MILESTONE FUNDS' BID & OFFER PRICES
[SIAMLETF40]>> DAILY INDICATIVE PRICES
[XNSA]]>> H2 2025 BC/DR TEST: ONBOARDING PROCESS TO NGX DR VPN
[XNSA]>> H2 2025 BC/DR TEST
[XNSA]>> INTRODUCTION OF COMMERCIAL PAPER LISTING AND TRADING ON NGX
[XNSA]>> CHAMPION BREWERIES PLC: ACTIVATION OF CODE FOR TRADING IN RIGHTS
Chart Of The Day - ASI Chart Vs ASI Advance Decline Line (YTD) (10-Dec-2025 15:09:00.211)
InfoWARE AI Analyst Daily Market Report: 10-Dec-2025
[VETGOODS]>> DAILY INDICATIVE PRICES
[XNSA]]>> H2 2025 BC/DR TEST: ONBOARDING PROCESS TO NGX DR VPN
[XNSA]>> H2 2025 BC/DR TEST
[XNSA]>> LISTING OF CHAPEL HILL DENHAM MANAGEMENT LIMITED'S SERIES 11
[XNSA]>> INTRODUCTION OF COMMERCIAL PAPER LISTING AND TRADING ON NGX
[STANBICETF30]>> DAILY INDICATIVE PRICES
[XNSA]>> CHAMPION BREWERIES PLC: ACTIVATION OF CODE FOR TRADING IN RIGHTS
Chart Of The Day - ASI Chart Vs ASI Advance Decline Line (YTD) (09-Dec-2025 15:07:20.154)
InfoWARE AI Analyst Daily Market Report: 09-Dec-2025
[XNSA]>> CORDROS MILESTONE FUNDS' BID & OFFER PRICES
[XNSA]]>> H2 2025 BC/DR TEST: ONBOARDING PROCESS TO NGX DR VPN
[VSPBONDETF]>> DAILY INDICATIVE PRICES
[LOTUSHAL15]>> DAILY INDICATIVE PRICES
[XNSA]>> H2 2025 BC/DR TEST
[XNSA]>> INTRODUCTION OF COMMERCIAL PAPER LISTING AND TRADING ON NGX
[XNSA]>> OFF MARKET TRADE
[SIAMLETF40]>> DAILY INDICATIVE PRICES
Get IDIA - the stock trading app for the modern investor
Solutions by Business
Product Suites
Company
Contacts
- 8th Floor,
- South Atlantic Petroleum Towers,
- 1 Adeola Odeku Street,
- Victoria Island,
- Lagos, Nigeria.
- Email: solutions@infowarelimited.com
Follow Us
 |
 |
 |
 |