


InfoWARE AI Analyst Daily Market Report: 10-Dec-2025 | InfoWARE Finance
Get IDIA - the stock trading app for the modern investor


InfoWARE AI Analyst Daily Market Report: 10-Dec-2025
(Source: InfoWARE Terminal, Date: 10-Dec-2025)
Dear Investor,
NGX Market Summary – Wednesday, December 10, 2025
The Nigerian equities market posted a marginal decline today, with the All Share Index (ASI) slipping -0.05% to close at 146,940.29. Despite the slight dip, the market retains a robust YTD gain of 42.34%. Market turnover nosedived by -44.30%, totalling ₦11.47bn from the prior session’s ₦20.59bn, underscoring a marked drop in activity. Market breadth was positive at 1.26x—34 advancers to 27 decliners—even as total traded volume decreased. Notably, small- and mid-cap ETFs dominated both gainers and losers lists, while several financial names emerged among the most heavily traded, especially among institutional investors. On the currency front, the Naira lost 0.05% to settle at 1,451/USD.
Key Market Highlights
- Market Breadth: Slightly risk-on, with advancers (34) outstripping decliners (27), assisted by ETF-led rallies.
-
Top Gainers:
- JAPAUL GOLD (+10.00%) – Strong bullish swing, RSI at 55.4 after a major jump in price and positive 5-day returns.
- MERGROWTH ETF (+10.00%) – RSI at a scorching 83.7, suggesting an overbought and possibly overheated rally.
- SIAMLETF40 & GREENWETF (~+10% each) – ETF products continue to dominate the YTD leaderboard, with SIAMLETF40's RSI at 94.7 (deeply overbought) and GREENWETF showing fresh bullish momentum.
-
Top Losers:
- STANBICETF30 (-10.00%) – A significant technical pullback after an already elevated RSI (77.95).
- CHAMS (-10.00%); HALDANE MCCALL (-8.88%): Both with mid-to-high RSIs, suggesting further corrective risk especially for CHAMS, whose RSI is above 57.
Deeper Insights & Key Takeaways
- Turnover Watch: The steep -44.30% drop in market turnover signals profit taking and possible trader caution after recent ETF-driven froth. If this persists, expect further range-bound trading or profit booking.
-
Momentum & Volume Patterns:
- Extreme RSI in ETFs: Multiple ETFs (MERGROWTH, SIAMLETF40, MERVALUE) show RSIs > 80, suggesting the rally may be stretched—contrarian traders should exercise caution here.
- Unusual Volume Alerts: CUTIX saw a >28x jump in volume, FCMB, CONHALLPLC, TANTALIZER, and JAIZBANK also flagged with >200% surges—this generally hints at institutional accumulation, sharp sentiment shifts, or news-driven trades. But not all high-volume names closed up—watch for bull/bear traps.
-
YTD Trends:
- Top YTD Gainers Overlap: MERVALUE ETF (+129.14%), GREENWETF, SIAMLETF40, MERGROWTH, JAPAUL GOLD all feature in both daily and YTD performance tables—momentum players should track these for trend continuation but beware of elevated RSI.
- YTD Losers-to-Day: STANBICETF30, UACN, HALDANE MCCALL, SUNUASSUR show continued weakness—these are in technical drawdowns and may invite bargain hunting, though declining momentum suggests patience.
- Bullish Momentum: GREENWETF and PRESTIGE cross above their 15DMA with strong % gains; watch for sustained buying as their technicals now align with positive sector flows.
- Bearish Momentum: HMCALL (RSI 60.8) and LINKASSURE (RSI 42), crossing below 15DMA, suggest short-term downside risk. Moves like this, especially if volume rises, are often leading indicators for further declines.
- Institutional vs. Retail Focus: Institutions dominated both volume (84.5%) and value traded (88.5%); retail made up 62.7% of trades but with only 11.5% of value, underscoring their focus on lower-priced or less liquid names (see more below).
Contrarian Signals
- MERGROWTH ETF: RSI at 83.7 (overbought), +53% YTD, and another +10% today. Despite technical euphoria, volumes haven't spiked as might be expected—suggesting complacency. A pullback could be brewing.
- STANBICETF30: Despite a -10% drop today, its RSI remains high at 77.95—typically, a fall of this size would move RSI much lower; another sign that ETF momentum may be fading.
- HMCALL: Sits in both top daily and YTD loser tables, yet RSI is neutral (>60) and MACD shows no distinct bearish crossover—could attract short-term reversal traders.
Sector Heatmap & Technical Overview
| Sector | Notable Gainers | Notable Losers | Bullish (15DMA↑) | Bearish (15DMA↓) | Institutional Focus |
|---|---|---|---|---|---|
| ETF/Index | MERGROWTH, SIAMLETF40, MERVALUE, GREENWETF | STANBICETF30, VETGOODS | GREENWETF | VETGOODS | n/a |
| Banking | FidelityBk (institutionals heavy), GTCO, ZenithBank | UBA (retail-heavy trades), AccessCorp | - | - | GTCO (21.54%), FidelityBk (9.49%), ZenithBank (4.75%) |
| Insurance | CONHALLPLC (+233% vol) | SUNUASSUR | PRESTIGE | LINKASSURE | |
| Consumer | TANTALIZER (unusual vol) | UACN | |||
| Specialty | JAPAULGOLD | HMCALL, OMATEK | HMCALL, OMATEK |
Dividend–Beta Matrix: Defensive Plays
| Stock | Dividend Yield (%) | Beta | Momentum (RSI) | Implication |
|---|---|---|---|---|
| PRESTIGE | 2.50 | 0.17 | – | Low-risk and showing bullish signal (above 15DMA): Likely to attract defensive/ yield-seeking buyers. |
| LINKASSURE | 5.56 | 0.41 | 42.05 | High dividend, low beta, but bearish technicals today; could be a value rebound target if market stabilizes. |
| FCMB | – | 1.17 | – | Unusual volume with moderate beta: speculative yield hunters may pile in if dividends are announced. |
Institutional Clustering Alerts
- ZENITHBANK: Controlled 20.17% of institutional trade value (₦591.7m) with relatively modest price change—evidence of large block trading/positioning.
- FIDELITYBK and GTCO: Each captured over 9% and 21.5% of institutional value traded respectively. These are likely being accumulated for year-end positioning—watch for breakout rallies into January.
Dividend + Momentum Note
- PRESTIGE: Stands out with 2.5% yield, low beta, and a bullish crossover—arguably the safest "defensive momentum” play in this session. Yield plus technical breakout makes this one to monitor closely.
- LINKASSURE: High dividend yield and low beta, but recent technical breakdown—dividend hunters should wait for the RSI to stabilize.
Actionable Ideas & Trader Cautions
- Bullish Momentum Opps: GREENWETF, PRESTIGE, JAPAULGOLD—momentum buyers can ride these but should beware of overbought territory for GREENWETF and JAPAULGOLD.
- Overextended ETFs: MERGROWTH, SIAMLETF40, and MERVALUE are red hot but look vulnerable to mean reversion; don’t chase strength blindly.
- Volume/Speculative Watch: CUTIX’s massive volume burst (+2839%) likely means a technical or fundamental catalyst—high risk, high reward.
- Yield + Momentum Blends: PRESTIGE is a rare mix of yield and momentum (bullish 15DMA cross). Value investors should track price reaction the next two sessions.
- Bearish Sentiment Caution: HMCALL, SUNUASSUR, UACN—all bearishly aligned technically and for YTD return; best avoided short-term unless clear reversal signals emerge.
Top 5 YTD Gainers
| Name | Symbol | Price | YTD Chg (%) | 5D Chg (%) | RSI | DivYield |
|---|---|---|---|---|---|---|
| MERISTEM VALUE ETF | MERVALUE | 416.24 | 129.14 | 33.02 | 92.78 | 0.00 |
| GREENWICH ASSET ETF | GREENWETF | 330.01 | 56.33 | 29.65 | 47.91 | 0.00 |
| VETIVA INDUSTRIAL ETF | VETINDETF | 70.67 | 83.99 | 28.33 | 64.37 | 0.00 |
| SIAML PENSION ETF40 | SIAMLETF40 | 770.11 | 67.74 | 20.99 | 94.75 | 0.00 |
| MERISTEM GROWTH ETF | MERGROWTH | 550.10 | 53.39 | 20.99 | 83.68 | 0.00 |
Top 5 YTD Losers
| Name | Symbol | Price | YTD Chg (%) | 5D Chg (%) | RSI | DivYield |
|---|---|---|---|---|---|---|
| SUNU ASSURANCES | SUNUASSUR | 4.30 | -65.67 | -7.83 | 42.05 | 0.99 |
| HALDANE MCCALL PLC | HMCALL | 4.39 | -17.86 | -8.88 | 60.82 | 0.00 |
| CUSTODIAN AND ALLIED PLC | CUSTODIAN | 36.75 | 116.37 | -7.27 | 31.66 | 1.20 |
| U A C N PLC. | UACN | 88.00 | 145.22 | -16.53 | 66.57 | 1.00 |
| STANBIC IBTC ETF 30 | STANBICETF30 | 1575.00 | 284.15 | -13.86 | 77.95 | 0.00 |
Market Activity Analysis: Institutional vs Retail
- Institutions: Drove 84.5% of market volume and 88.5% of trade value but made just 37.3% of the day’s trade count—signaling larger trade sizes and a focus on liquid blue-chips and ETFs.
- Retail: Accounted for 62.7% of trades but a mere 11.5% of traded value. Preferred more affordable or less liquid stocks. For instance, MTNN was among the most traded by retail, though it barely featured in institutional lists.
-
Top 5 Most Traded (Institutional):
- GTCO: 21.54% value share, steady price, slight uptick. Evidence of block trading/strategic positioning.
- ACCESSCORP: 6.60% of volume, but negative %Chg reflects consistent institutional rotation.
- ZENITHBANK: Large volume and value but little price action; signs of stealth accumulation.
- DANGCEM: Cement giant sees steady institutional trade but flat pricing.
- FIDELITYBK: Largest single stock by volume—could shift leadership if accumulation persists.
-
Top 5 Most Traded (Retail):
- ACCESSCORP: Both retail and institutions are active, but volatility is higher in retail.
- MTNN: Attracts speculative retail interest, despite low volatility.
- GTCO/UBA/ZENITHBANK: Clearly, large banks are the focus across both investor classes; traders should watch for retail-institutional trade divergence, which often signals reversals or new trends.
- Hidden Pattern: Strong overlap between institutional and retail in the big banks (GTCO, ZENITHBANK, ACCESSCORP)—a sign of consensus positioning. This often precedes significant price movements when volume surges on either side.
Hidden Insights & Outlook
- ETF and index products are massively outperforming, but RSI extremes warn of a looming reversion—or at least elevated volatility.
- Defensive yield names (esp. PRESTIGE & LINKASSURE) are catching a technical bid; income-seekers should keep these on the radar.
- Unusually high volumes in CUTIX and others often front-run either corporate activity, incoming news, or a change of ownership—traders could see outsized moves here soon.
- If market turnover continues to shrink and breadth narrows, expect increased choppiness or a possible market-wide pause after a strong run-up YTD.
Note: All returns and indicators are as of close Wednesday, December 10, 2025. Trends can change rapidly. Use technical signals alongside fundamental research for all investment decisions.
|
Top ASI Gainers Over Last 5 Trading Days
|
Top ASI Losers Over Last 5 Trading Days
|
For more detailed analysis, on InfoWARE Market Data Terminal <NSEPERF> <GO>
On InfoWARE Finance Mobile App (Android, iPhone & iPad, Windows Phone and Windows 8/10), "Top Gainers & Losers"
JAPAUL GOLD & VENTURES PLC (JAPAULGOLD) topped the advancers list closing at N2.53 with a gain of 10.00% followed by MERISTEM GROWTH EXCHANGE TRADED FUND (MERGROWTH) which closed at N605.11 with a gain of 10.00%.
On the flip side CHAMS PLC (CHAMS) and STANBIC IBTC ETF 30 (STANBICETF30) topped the decliners log with a loss of -10.00% at a close of N3.06, and -10.00% to close the day at N1,417.50 respectively.
| Symbol | LClose | %Chg |
|---|---|---|
| JAPAULGOLD | 2.53 | 10.00 |
| MERGROWTH | 605.11 | 10.00 |
| SIAMLETF40 | 847.12 | 10.00 |
| GREENWETF | 363.01 | 10.00 |
| MERVALUE | 457.60 | 9.94 |
| Symbol | LClose | %Chg |
|---|---|---|
| CHAMS | 3.06 | -10.00 |
| STANBICETF30 | 1,417.50 | -10.00 |
| HMCALL | 4.00 | -8.88 |
| UACN | 80.80 | -8.18 |
| LOTUSHAL15 | 82.00 | -7.13 |
For more detailed analysis,
- On InfoWARE Market Data Terminal <TOPG> <GO>
- On InfoWARE Finance Mobile App ( Android, iPhone & iPad and Windows 10) , "Top Gainers & Losers"
Currency Market
In the currency market, the Naira fell 0.05%(-0.71) against the Dollar to settle at 1 to 1NSE: Bull Signal - Price crossed above 15 Day MA
This signal implies these stocks are under buying pressure and the price might continue to rise and therefore positions should be monitored closely. Further suggested analysis include looking at the overall market (ASI) to see if the uptrend is market wide, sector wide or specific to the stock. Portfolio managers tend to use this as a signal to do more research to add to their positions or lock in some profits. Typically further analysis should be done using commands like PC and RV on the InfoWARE Market Data Terminal. Another command is ALERTS to set price triggers for possible exit or entry as necessary
For more detailed analysis,
- On InfoWARE Market Data Terminal <NSEPERF> <GO>
- On InfoWARE Finance Mobile App ( Android , iPhone & iPad and Windows 10) , "Top Gainers & Losers"
| Symbol | Price | %Chg | 15DMA | PE | EPS | DivY | MktCap | Vol | Trades | Value | LstTradeTime |
|---|---|---|---|---|---|---|---|---|---|---|---|
| GREENWETF | 363.01 | 9.09 | 335.10 | 0.00 | 0.00 | 2.50K | 22.00 | 907.89K | 10-Dec-2025 14:30:49.610 | ||
| PRESTIGE | 1.63 | 8.59 | 1.56 | 10.49 | 0.08 | 2.50 | 21.60B | 728.63K | 23.00 | 1.19M | 10-Dec-2025 14:30:14.070 |
| FTNCOCOA | 4.96 | 1.01 | 4.94 | 0.00 | 0.00 | 1.60 | 19.34B | 1.31M | 109.00 | 6.47M | 10-Dec-2025 14:30:12.483 |
| NGXMERIGRW | 9,961.42 | 0.07 | 9,959.99 | 34.89 | 293.99 | 0.00 | 0.00 | 55.82M | 2,575.00 | 1.35B | 10-Dec-2025 14:30:24.550 |
NSE: BEAR Signal - Price crossed below 15 Day MA
This signal implies these stocks are under selling pressure and the price might continue to slide and therefore positions should be monitored closely. Further suggested analysis include looking at the overall market (ASI) to see if the downtrend is market wide, sector wide or specific to the stock. If the overal market trend is upwards, then since these stocks are heading in the opposite direction, then further analysis should be done using commands like PC and RV on the InfoWARE Market Data Terminal. Another command is ALERTS to set price triggers for possible exit is necessar
For more detailed analysis,
- On InfoWARE Market Data Terminal <BEARM> <GO>
- On InfoWARE Finance Mobile App ( Android , iPhone & iPad and Windows 10)
| Symbol | Price | %Chg | 15DMA | PE | EPS | DivY | MktCap | Vol | Trades | Value | LstTradeTime |
|---|---|---|---|---|---|---|---|---|---|---|---|
| ETRANZACT | 14.00 | 0.00 | 14.03 | 171.51 | 0.04 | 1.48 | 128.80B | 2.17M | 145.00 | 28.60M | 10-Dec-2025 14:30:12.290 |
| FG162049S2 | 105.00 | 0.00 | 105.00 | 0.00 | 103.99B | 0.00 | 0.00 | 0.00 | 10-Dec-2025 14:30:20.920 | ||
| OMATEK | 1.15 | -2.61 | 1.16 | 6.82 | 0.10 | 0.00 | 3.38B | 1.50M | 57.00 | 1.74M | 10-Dec-2025 14:30:13.913 |
| LINKASSURE | 1.76 | -4.55 | 1.78 | 59.89 | 0.02 | 5.56 | 24.64B | 1.04M | 40.00 | 1.84M | 10-Dec-2025 14:30:49.483 |
| VETGOODS | 35.00 | -6.86 | 37.02 | 0.00 | 0.00 | 7.72K | 7.00 | 314.49K | 10-Dec-2025 14:30:49.703 | ||
| FG202034S2 | 106.98 | -9.26 | 115.18 | 0.00 | 0.00 | 89.16K | 1.00 | 95.39M | 10-Dec-2025 14:30:21.210 | ||
| HMCALL | 4.00 | -9.75 | 4.28 | 0.00 | 0.00 | 0.00 | 0.00 | 257.45K | 14.00 | 1.07M | 10-Dec-2025 14:30:12.630 |
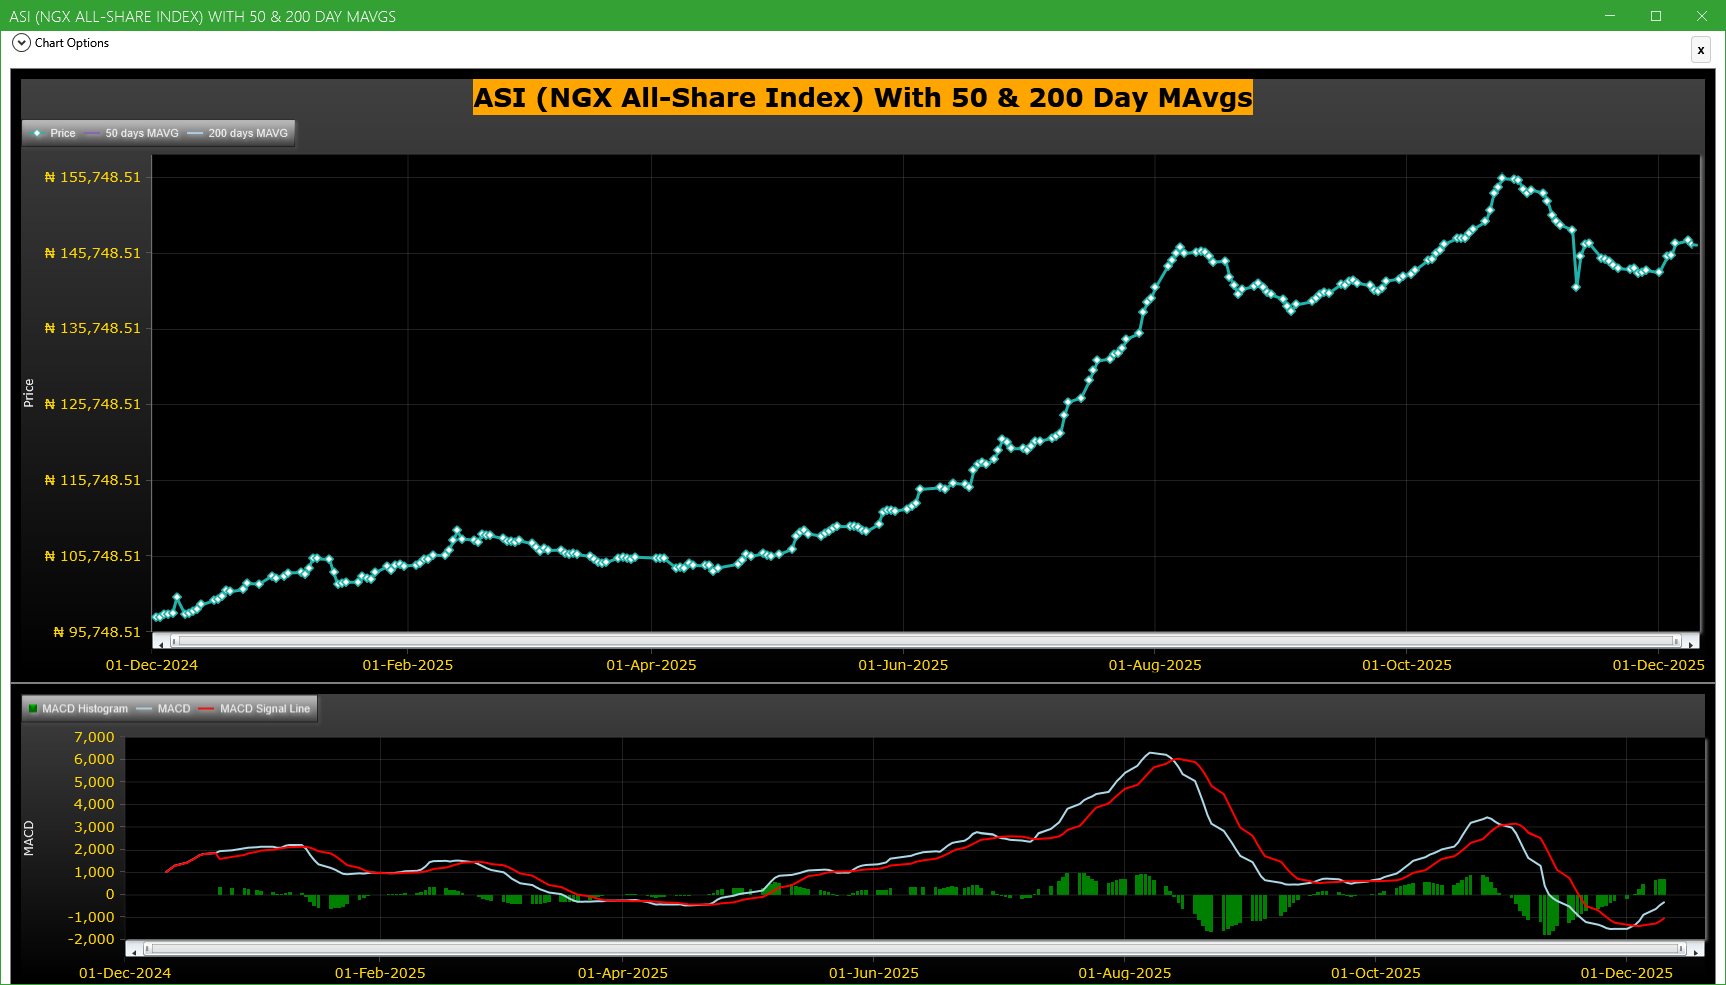
Market Trend - ASI (NGX All-Share-Index) With 50 & 200 Day MAvgs Chart
Technical traders typically use the 50 & 200 day moving averages to aid in choosing
where to enter or exit a position, which then causes these levels to act as strong
support or resistance. As a general guideline, if the price is above a moving average,
the trend is up. If the price is below a moving average, the trend is down.
It is important to note that critics of technical analysis say that moving averages act
as support and resistance because so many traders use these indicators to inform their
trading decisions. Also moving averages tend to work quite well in strong trending conditions
but poorly in choppy or ranging conditions.
Trading Strategies: Crossovers
Crossovers are one of the main moving average strategies. The first type is a price crossover,
which is when the price crosses above or below a moving average to signal a potential change
in trend. Another strategy is to apply two moving averages to a chart: one longer and one
shorter. When the shorter-term MA crosses above the longer-term MA, it is a buy signal, as
it indicates that the trend is shifting up. This is known as a golden cross. Meanwhile, when
the shorter-term MA crosses below the longer-term MA, it is a sell signal, as it indicates that
the trend is shifting down. This is known as a dead/death cross
For more detailed analysis,
- On InfoWARE Market Data Terminal <CI> <GO>
- On InfoWARE Finance Mobile App ( Android , iPhone & iPad and Windows 10) , "Research"
Unusual Volume: Volume traded is more than double the 90 day moving average (All exchanges; ASI & ASem). For more detailed analysis,
- On InfoWARE Market Data Terminal <UV> <GO>
- On InfoWARE Finance Mobile App ( Android , iPhone & iPad and Windows 10)
| Symbol | Name | Volume | 90DAvgVol | %VolChg | Price | LClose | %Chg | Trades | Value |
|---|---|---|---|---|---|---|---|---|---|
| CUTIX | CUTIX PLC. | 122.91M | 4.18M | 2,839.27 | 3.03 | 3.00 | 1.00 | 215 | 369.08M |
| FCMB | FCMB GROUP PLC. | 80.67M | 23.33M | 245.72 | 11.00 | 10.95 | 0.46 | 389 | 879.25M |
| CONHALLPLC | CONSOLIDATED HALLMARK INSURANCE PLC | 71.18M | 21.40M | 232.54 | 4.30 | 4.02 | 6.97 | 44 | 286.40M |
| TANTALIZER | TANTALIZERS PLC | 57.84M | 10.87M | 431.92 | 2.30 | 2.33 | -1.29 | 153 | 136.45M |
| JAIZBANK | JAIZ BANK PLC | 43.79M | 8.76M | 399.88 | 4.45 | 4.50 | -1.11 | 355 | 195.60M |
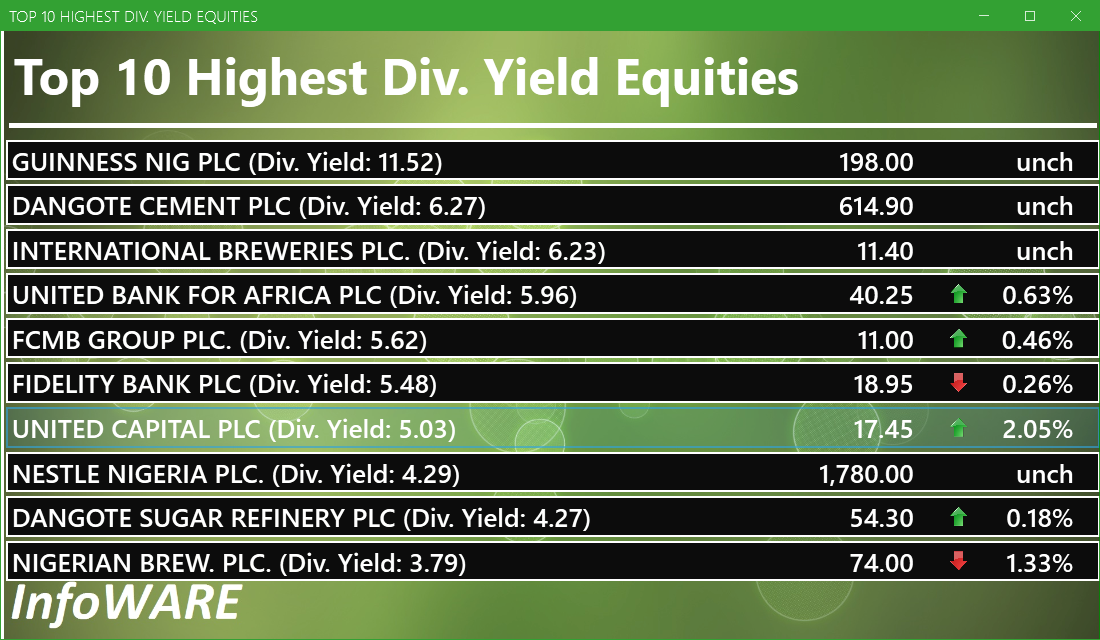
Investment Insights - High Div. Stocks
Dividend stocks distribute a portion of the company earnings to investors on a regular basis and they can a great choice for investors looking for regular income. As an investment or trading strategy, high dividend yield equities provide annual cash payments as against mostly capital gains in the price of a stock. The list in the table below represent the highest dividend paying stocks from the list of the most liquid stocks in the NSE top 30.
For more detailed analysis,
- On InfoWARE Market Data Terminal <HYIELD> <GO>
- On InfoWARE Finance Mobile App ( Android , iPhone & iPad and Windows 10) , "Research"
Investment Insights - Stocks outperforming the ASI but with approximately the same risk
These list of stocks represent equities that are less risky than the ASI but doing better than the ASI (All Shares Index) using the YTD (Year to Date) returns as the measure. The risk is measured by Beta. Beta is an assessment of a stock's tendency to undergo price changes, (its volatility), as well as its potential returns compared to the ASI. It is expressed as a ratio, where a score of 1 represents performance comparable to the ASI, and returns above or below the market may receive scores greater or lower than 1.
For a full list of both positively and negatively corelated stocks visit InfoWARE Market Data Terminal
- On InfoWARE Market Data Terminal <BANL> <GO>
- On InfoWARE Finance Mobile App ( Android , iPhone & iPad and Windows 10)
| Symbol | DivYield | PE | EPS | Beta | %ChgYTD | ASIYTDReturn | BetaDiff |
|---|---|---|---|---|---|---|---|
| HONYFLOUR | 1.40 | 16.28 | 0.31 | 0.99 | 177.46 | 42.34 | 0.01 |
| CAVERTON | 5.52 | 1.15 | 1.57 | 0.98 | 115.69 | 42.34 | 0.02 |
| ROYALEX | 7.81 | 0.00 | 0.00 | 0.96 | 68.18 | 42.34 | 0.04 |
| DEAPCAP | 13.76 | 188.84 | 0.01 | 0.89 | 43.33 | 42.34 | 0.11 |
| UNIVINSURE | 0.00 | 0.00 | 0.00 | 0.83 | 59.72 | 42.34 | 0.17 |
| FTNCOCOA | 1.60 | 0.00 | 0.00 | 0.79 | 163.83 | 42.34 | 0.21 |
| NB | 3.79 | 16.95 | 1.60 | 0.79 | 131.25 | 42.34 | 0.21 |
| MAYBAKER | 3.75 | 58.94 | 0.14 | 0.78 | 75.53 | 42.34 | 0.22 |
| UNILEVER | 2.81 | 67.09 | 0.40 | 0.75 | 100.00 | 42.34 | 0.25 |
| VETGOODS | 0.00 | 0.71 | 103.49 | 42.34 | 0.29 |
African Markets
| Name | LClose | Change | %Chg |
|---|---|---|---|
| BRVM Stock Exchange | 350.57 | -2.19 | -0.62 |
| Botswana Stock Exchange | 10,815.83 | 3.24 | 0.03 |
| Egyptian Exchange | 41,940.62 | -20.98 | -0.05 |
| Ghana Stock Exchange | 8,628.21 | -2.59 | -0.03 |
| Johannesburg Stock Exchange | 110,730.60 | -99.75 | -0.09 |
| Lusaka Stock Exchange | 25,308.72 | -2.53 | -0.01 |
| Casablanca Stock Exchange | 18,458.70 | -14.78 | -0.08 |
| Malawi Stock Exchange | 612,728.12 | -1,905.36 | -0.31 |
| Nigeria Stock Exchange | 146,940.29 | -486.51 | -0.33 |
| Nairobi Securities Exchange | 176.80 | -2.33 | -1.30 |
| Namibian Stock Exchange | 2,060.30 | -2.68 | -0.13 |
| Rwanda Stock Exchange | 180.87 | 0.34 | 0.19 |
| Tunis Stock Exchange | 13,222.60 | 2.64 | 0.02 |
| Uganda Securities Exchange | 1,505.89 | -3.77 | -0.25 |
Nigeria Market Indexes
| Symbol | LClose | %Chg | WTD% | MTD% | QTD% | YTD% | MktCap | Trades |
|---|---|---|---|---|---|---|---|---|
| ASI | 146,861.98 | -0.05 | -0.38 | 2.55 | 2.72 | 42.34 | 18,031 | |
| NGX30 | 5,375.46 | -0.05 | -0.29 | 2.64 | 3.02 | 40.91 | 9,642 | |
| NGXAFRBVI | 3,267.31 | -0.18 | -0.16 | 4.94 | -7.95 | 31.70 | 3,838 | |
| NGXAFRHDYI | 21,108.20 | 0.24 | -0.90 | 1.58 | -5.18 | 23.97 | 4,334 | |
| NGXASEM | 1,392.88 | 0.00 | 0.00 | 0.00 | -9.44 | -12.05 | 2 | |
| NGXBNK | 1,437.03 | -0.11 | -0.17 | 3.88 | -5.26 | 32.15 | 4,107 | |
| NGXCG | 3,969.49 | -0.15 | -0.26 | 3.41 | -2.01 | 40.30 | 9,273 | |
| NGXCNSMRGDS | 3,472.33 | -0.14 | -0.14 | 2.54 | 2.65 | 100.21 | 2,322 | |
| NGXCOMMDTY | 1,172.91 | 0.00 | -0.49 | -0.73 | 4.55 | 17.29 | ||
| NGXGROWTH | 16,891.72 | 6.41 | 14.08 | 14.25 | 12.07 | 117.60 | 252 | |
| NGXINDUSTR | 5,524.58 | 0.00 | -0.06 | 7.69 | 9.01 | 54.68 | 1,591 | |
| NGXINS | 1,097.50 | -0.39 | -1.91 | 1.27 | -8.24 | 39.60 | 1,192 | |
| NGXLOTUSISLM | 12,905.70 | 0.00 | -0.89 | 1.13 | 8.71 | 85.22 | 3,331 | |
| NGXMAINBOARD | 7,043.50 | -0.06 | -0.54 | 0.83 | -0.02 | 40.76 | 13,176 | |
| NGXMERIGRW | 9,961.42 | 0.07 | -1.56 | -0.02 | 0.59 | 52.71 | 2,575 | |
| NGXMERIVAL | 12,779.98 | -0.44 | -1.11 | 3.77 | -4.40 | 22.53 | 4,766 | |
| NGXOILGAS | 2,683.95 | -0.08 | 0.00 | -0.46 | 6.25 | -1.00 | 290 | |
| NGXPENBRD | 2,760.70 | -0.07 | -0.45 | 2.46 | 4.13 | 50.72 | 14,725 | |
| NGXPENSION | 6,773.33 | -0.11 | -0.49 | 2.30 | 0.53 | 49.39 | 10,996 | |
| NGXPREMIUM | 14,909.28 | -0.06 | -0.16 | 5.85 | 8.89 | 53.18 | 4,603 | |
| NGXSOVBND | 659.64 | -0.56 | -2.02 | -2.05 | 0.36 | 9.66 | 0 |
For more detailed analysis,
- On InfoWARE Market Data Terminal <MKTINS> <GO>
- On InfoWARE Finance Mobile App ( Android, iPhone & iPad and Windows 10) , "Market Indexes"
Find the topic interesting? Will like to comment? Contact Us at solutions@infowarelimited.com
Top News

Chart Of The Day - ASI Chart Vs ASI Advance Decline Line (YTD) (10-Dec-2025 15:09:00.211)
InfoWARE AI Analyst Daily Market Report: 10-Dec-2025

[VETGOODS]>> DAILY INDICATIVE PRICES
[XNSA]]>> H2 2025 BC/DR TEST: ONBOARDING PROCESS TO NGX DR VPN
[XNSA]>> H2 2025 BC/DR TEST
[XNSA]>> LISTING OF CHAPEL HILL DENHAM MANAGEMENT LIMITED'S SERIES 11
[XNSA]>> INTRODUCTION OF COMMERCIAL PAPER LISTING AND TRADING ON NGX
[STANBICETF30]>> DAILY INDICATIVE PRICES
[XNSA]>> CHAMPION BREWERIES PLC: ACTIVATION OF CODE FOR TRADING IN RIGHTS
Chart Of The Day - ASI Chart Vs ASI Advance Decline Line (YTD) (09-Dec-2025 15:07:20.154)
InfoWARE AI Analyst Daily Market Report: 09-Dec-2025
[XNSA]>> CORDROS MILESTONE FUNDS' BID & OFFER PRICES
[XNSA]]>> H2 2025 BC/DR TEST: ONBOARDING PROCESS TO NGX DR VPN
[VSPBONDETF]>> DAILY INDICATIVE PRICES
[LOTUSHAL15]>> DAILY INDICATIVE PRICES
[XNSA]>> H2 2025 BC/DR TEST
[XNSA]>> INTRODUCTION OF COMMERCIAL PAPER LISTING AND TRADING ON NGX
[XNSA]>> OFF MARKET TRADE
[SIAMLETF40]>> DAILY INDICATIVE PRICES
[XNSA]>> APPOINTMENT OF A DIRECTOR
[XNSA]>> CHAMPION BREWERIES PLC: ACTIVATION OF CODE FOR TRADING IN RIGHTS
Chart Of The Day - ASI Chart Vs ASI Advance Decline Line (YTD) (08-Dec-2025 15:16:49.745)
InfoWARE AI Analyst Daily Market Report: 08-Dec-2025
[XNSA]>> DAILY FUND PRICE SUBMISSION - FCMB ASSET MANAGEMENT LIMITED
[VETBANK]>> DAILY INDICATIVE PRICES
[XNSA]>> RECLASSIFICATION FROM LOW PRICE STOCK GROUP TO MEDIUM PRICE STOCK GROUP
[XNSA]>> RECLASSIFICATION FROM MEDIUM PRICE STOCK GROUP TO HIGH PRICE STOCK GROU
[XNSA]>> H2 2025 BC/DR TEST
[XNSA]>> INTRODUCTION OF COMMERCIAL PAPER LISTING AND TRADING ON NGX
[LOTUSHAL15]>> DAILY INDICATIVE PRICES
Get IDIA - the stock trading app for the modern investor
Solutions by Business
Product Suites
Company
Contacts
- 8th Floor,
- South Atlantic Petroleum Towers,
- 1 Adeola Odeku Street,
- Victoria Island,
- Lagos, Nigeria.
- Email: solutions@infowarelimited.com
Follow Us
 |
 |
 |
 |