


InfoWARE AI Analyst Daily Market Report: 01-Dec-2025 | InfoWARE Finance
Get IDIA - the stock trading app for the modern investor


InfoWARE AI Analyst Daily Market Report: 01-Dec-2025
(Source: InfoWARE Terminal, Date: 01-Dec-2025)
Dear Investor,
Nigerian Equity Market Daily Summary – Monday, December 1, 2025
The NGX All Share Index closed down by -0.22% at 143,520.53, slightly below its previous close. Despite this mild retreat, the index maintains a robust YTD gain of 38.8%. Market turnover rose to ₦13.13B (+3.14%), with trading volumes at 543.87M (up from Friday’s 488M), reflecting a modest revival in activity. However, market breadth tilted bearishly at 0.77x, with 23 advancers versus 30 decliners, suggesting prevailing profit-taking and mixed sentiment. The Naira gained modestly against the Dollar (+0.19%), providing a tailwind for foreign-positioned investors.
Quick Recap of Last Week (Nov 24-28, 2025):
- Index: NGX ASI traded sideways after recent highs, with intermittent profit-taking in tier-1 banks and industrials.
- Turnover: Rangebound, with institutional trades dominating (≈75%+), but retail volumes staying strong in small/mid-caps.
- Sector rotation: Profit-taking in ETFs and select industrials; insurance and select consumer names saw brief accumulation.
- Key focus: Bullish momentum names continued to outperform, but several previously stellar performers (notably ETFs) began to falter, presaging today's bearish breadth.
Key Trends & Market Breadth Insights
- Market breadth: Narrow (0.77x). More decliners than advancers – short-term risk-off or sectoral rotation at play.
- Advancers: 23 stocks up; 30 down.
- Volume was up for 71 companies and down for 70—a highly balanced tape, albeit with negative lead from price decliners.
- Top winners and losers show clustering at both extremes, particularly among ETFs and mid/small-caps.
Daily Top Gainers & Top Losers
Top 5 Gainers (Table)
| Stock | %Change | RSI | MACD | 15DMA/50DMA | Beta |
|---|---|---|---|---|---|
| NCR | +9.98% | 99.5* | 9.11 | 37.90 / 22.67 | -0.14 |
| STANBICETF30 | +9.94% | 81.76* | 110.2 | 825.8 / 600.8 | -0.23 |
| SUNUASSUR | +9.18% | 27.9 | -0.23 | 4.46 / 5.07 | 0.27 |
| CHAMPION | +8.11% | 41.2 | -0.60 | 13.71 / 14.95 | 0.16 |
| MECURE | +7.58% | 43.7 | -0.1 | 27.8 / 27.9 | 0.0 |
*RSI above 70 often indicates overbought/overextended; risks of near-term reversal.
- NCR’s meteoric run is notable: YTD up 992.7%, RSI 99.5 (extremely overbought), bullish MACD and trading above both key MAs. Caution for new entries.
- STANBICETF30 is on a parabolic move—with YTD 212.2% and a nosebleed RSI. Both could attract profit-taking soon.
- Unusual volume on CHAMPION (134% of 90d average), aligning with its moving average breakout—momentum, but watch for stalling.
Top 5 Losers (Table)
| Stock | %Change | RSI | MACD | 15DMA/50DMA | Beta |
|---|---|---|---|---|---|
| INTBREW | -10.00% | 42.6 | -0.44 | 11.5 / 12.97 | 1.04 |
| GREENWETF | -10.00% | 33.2* | -0.80 | 361.2 / 339.2 | 0.83 |
| RTBRISCOE | -9.88% | 53.2 | -0.01 | 3.27 / 3.43 | -0.16 |
| CORNERST | -7.83% | 49.4 | -0.08 | 5.93 / 6.13 | 0.93 |
| DAARCOMM | -6.52% | 44.9 | -0.02 | 0.93 / 1.01 | 0.71 |
- GREENWETF is down -46.9% YTD, with RSI near 33 (approaching oversold)—potential stabilization ahead if sellers exhaust.
- RTBRISCOE and DAARCOMM continue their slow declines (both also in YTD loser tables), hinting at enduring structural weakness.
YTD Top 5 Gainers & Top 5 Losers (Monday Special)
| Gainer | YTD % | RSI | Div.Yld % | Loser | YTD % | RSI | Div.Yld % |
|---|---|---|---|---|---|---|---|
| NCR | +992.7 | 99.5* | 0.0 | GREENWETF | -46.9 | 33.2* | 0.0 |
| STANBICETF30 | +212.2 | 81.8* | 0.0 | VETGRIF30 | +46.5 | 50.0 | 0.0 |
| Ikejahotel | +157.1 | 83.3 | 0.9 | UPDC | +178.0 | 35.5 | 34.2 |
| ACADEMY | +133.3 | 53.1 | 3.5 | VETINDETF | +26.6 | 41.5 | 0.0 |
| NGXGROUP | +106.2 | 59.3 | 2.7 | CILEASING | +19.8 | 35.8 | 1.2 |
- Note: The YTD "Losers” column includes positive returns due to ETFs and structural volatility—watch for "mean-reversion” trades.
- NCR and STANBICETF30 appear in both daily and YTD top gainers, showing momentum strength but at risk of becoming "crowded trades.”
- GREENWETF and RTBRISCOE show up as both top daily losers and YTD underperformers—possible bottom-fishing opportunities as RSI approaches oversold levels.
Bullish and Bearish Momentum Tables – Hidden Insights
Bullish Crossovers (Closed Above 15DMA)- CHAMPION, GUINEAINS, LINKASSURE, AIICO, VITAFOAM among key names in bullish breakouts. CHAMPION especially noteworthy for also having unusual volume (+134% of 90d), suggesting institutional buying.
- RSIs for most bullish breakouts remain moderate (41–54), except NCR (99.5): highlights room for further upside for most, but NCR is clearly overheating and may experience pullbacks.
- Insurers: Multiple insurance names (AIICO, LINKASSURE, GUINEAINS) in bullish momentum, reflecting renewed sector confidence or rotation.
- Dividend-yielder VITAFOAM (7.03%) broke out on moderate volume—defensive income play with upside potential.
- RTBRISCOE and CORNERST show up as both bearish crossovers and daily losers, with sliding RSIs—downtrends may be persistent until sentiment improves.
- WAPCO shows a gentle breakdown—watch for sector pressure if this persists, given "Building Materials” weight.
- MANSARD and FIDELITYBK also feature in bearish momentum, both with modest RSIs ~31–48, signaling room for more downside if sell pressure increases.
Stocks With Unusual Volume – What’s Under the Hood?
| Stock | %Volume Increase | Price Change | Notes |
|---|---|---|---|
| WEMABANK | +797% | -0.27% | Volume surge, but price didn’t move—distribution phase? |
| CUSTODIAN | +1064% | 0.00% | Significant block trade(s) executed. |
| CHAMPION | +134% | +8.11% | Price and volume in sync; likely strong buying interest. |
| ACCESSCORP | +113% | 0.00% | Heavy institutional participation, but no price move—accumulation? |
Contrarian Signals
- CHAMPION: Despite +8.1% today, its RSI is at 41.2 (neutral), MACD slightly negative, but price crossed above 15DMA. The middling RSI amid bullish price/volume action may indicate further upside remains before overextension.
- WEMABANK: Huge volume spike (+797%), but price flat to down—possible "hidden” distribution by large holders even as retail crowds in.
- RTBRISCOE: Bearish momentum with an above-neutral RSI (53.2); mixed signals warn of choppy trading—avoid aggressive shorts.
- STANBICETF30: RSI at 81.8, up +9.9% today and a YTD behemoth (+212%). Overbought, but strong institutional/ETF flows dominating—contrarian traders may look for exhaustion soon.
Sector Heatmap
| Sector | Performers | Momentum | Color Code |
|---|---|---|---|
| Insurance | AIICO, GUINEAINS, LINKASSURE (bullish); MANSARD, CORNERST (bearish) | Mixed: Strong crossovers & selloffs | ⚪ |
| Banking | WEMABANK (unusual vol), FIDELITYBK (bearish crossover) | Neutral to Bearish | ⬛ |
| Consumer | CHAMPION (bullish), CADBURY (bullish) | Bullish breakouts | ⬆ |
| ETF/Index | STANBICETF30 (Extreme overbought), GREENWETF (large loser) | Highly volatile | 🔵 |
| Industrials/Materials | WAPCO (bearish crossover), VITAFOAM (bullish), MECURE (up) | Mixed | 🟨 |
Dividend-Beta Matrix – Defensive Opportunities
| Stock | Dividend Yield (%) | Beta | Notes |
|---|---|---|---|
| VITAFOAM | 7.03 | 0.47 | Defensive, good income, in bullish momentum today |
| AIICO | 4.13 | 1.33 | Bullish crossover; higher risk, but strong yield |
| CORNERST | 5.28 | 0.93 | Bearish momentum; yield may attract stabilization |
| FIDELITYBK | 5.48 | 0.89 | Bearish crossover; strong defensive yield |
| AFRIPRUD | 1.27 | 0.64 | Not in current mover tables, but remains a defensive watchlist candidate |
- Dividend-yielders with low beta (VITAFOAM, CORNERST, FIDELITYBK) provide shelter in downside volatility periods—good for income portfolios.
- Bearish momentum stocks with high yield (like CORNERST, FIDELITYBK) may offer re-entry windows when technical pressure abates.
Institutional Clustering Alerts
- ZENITHBANK: 81.5%+ by trade value, 4.09% of total market institutional volume—clear favorite for big blocks and efficient execution. Watch for signaling effects: when institutions crowd in/out, retail often follows.
- ACCESSCORP: Heavily traded by institutions (15.8% by volume), yet no price change; signals quiet accumulation—bullish prep for breakout?
- WAPCO, MTNN, UBA: All in top institutional flows, suggesting big money interest—MTNN, though, had flat performance and high retail activity as well.
Market Activity/Trades–Institutional vs Retail
- Institutions: 76.3% of volume, 87.6% of value, but just 1,567 trades (34.9% of deals)—block trading dominates. Watch ACCESSCORP and ZENITHBANK as institutional "thermometers.”
- Retail: 65.1% of total trades but only ~24% of volume; retail flocking to MTNN, ACCESSCORP, and ZENITHBANK for liquidity and safety in size.
-
Correlations:
- ZENITHBANK, ACCESSCORP, UBA: Feature heavily in both retail and institutional top trades, reinforcing their appeal for both liquidity seeking and block moves. Retail is "following smart money.”
- MTNN: Massive retail count but modest total volume suggests split between many small trades vs. a few big institutional blocks—could signal churn post large institutional positioning.
- Volumes: WEMABANK, CUSTODIAN, CHAMPION, and ACCESSCORP see abnormal volume—to be monitored for either further breakouts or a reversal as "dumb money” gets attracted.
| Top 5 Institutional | Top 5 Retail |
|---|---|
|
|
- Pattern: Heavy institutional/retail overlap in key banking names; new breakouts in less liquid small/mid-caps (NCR, CHAMPION) often lag institutional rotation.
Trader Suggestions: Opportunities & Cautions
- Momentum Players: Continue to ride NCR and STANBICETF30 but tighten stops—RSI extreme, and profit-taking risk is high.
- Contrarians: Watch for reversal setups in GREENWETF and RTBRISCOE—both oversold, persistent sellers may be exhausted soon.
- Defensive Longs: VITAFOAM is a rare blend of yield and upside—possible core addition on dips.
- Rotational Play: Insurance sector displaying both momentum and mean-reversion trades; be nimble and monitor for abrupt turns.
- Volume Spikes: Track WEMABANK/CUSTODIAN post unusual activity; confirmation is key to avoid "trap” rallies or dumps.
- Overlap Alert: Watch stocks appearing on multiple tables (e.g., CHAMPION)—these are often institutional targets before a more broad retail crowd-in occurs.
Summary:
- Markets are cautious but active, with institutional dominance and varied retail participation.
- Momentum is pivoting to selected small/mid-caps, while large-cap ETFs and banks show signs of sector rotation.
- Stay reactive to moving average/momentum signals, especially in fast-moving names with outsized volumes.
- Diversify exposure: don’t ignore defensive, dividend-yielding stocks—especially in choppy tape.
Legend: Green = positive performance or opportunity;Red = negative/overheated or caution.
RSI 70+ = overbought; 30- = oversold. Low beta = more defensive. 15DMA above 50DMA = bullish momentum.
"*": RSI above 70/80 = overextended. Use stops and disciplined risk management.
|
Top ASI Gainers Over Last 5 Trading Days
|
Top ASI Losers Over Last 5 Trading Days
|
For more detailed analysis, on InfoWARE Market Data Terminal <NSEPERF> <GO>
On InfoWARE Finance Mobile App (Android, iPhone & iPad, Windows Phone and Windows 8/10), "Top Gainers & Losers"
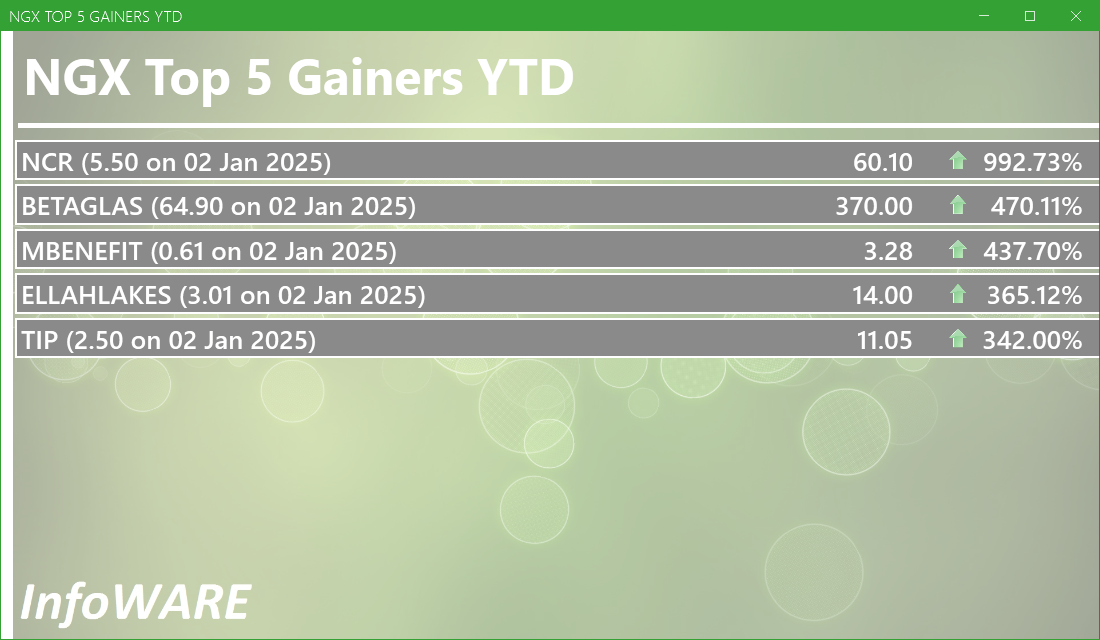
NCR (NIGERIA) PLC. (NCR) topped the advancers list closing at N60.10 with a gain of 9.97% followed by STANBIC IBTC ETF 30 (STANBICETF30) which closed at N1,152.20 with a gain of 9.94%.
On the flip side GREENWICH ASSET ETF (GREENWETF) and INTERNATIONAL BREWERIES PLC. (INTBREW) topped the decliners log with a loss of -10.00% at a close of N283.50, and -10.00% to close the day at N10.35 respectively.
| Symbol | LClose | %Chg |
|---|---|---|
| NCR | 60.10 | 9.97 |
| STANBICETF30 | 1,152.20 | 9.94 |
| SUNUASSUR | 4.28 | 9.18 |
| CHAMPION | 14.00 | 8.11 |
| MECURE | 29.80 | 7.58 |
| Symbol | LClose | %Chg |
|---|---|---|
| GREENWETF | 283.50 | -10.00 |
| INTBREW | 10.35 | -10.00 |
| RTBRISCOE | 3.10 | -9.88 |
| LOTUSHAL15 | 74.20 | -9.51 |
| CORNERST | 5.53 | -7.83 |
For more detailed analysis,
- On InfoWARE Market Data Terminal <TOPG> <GO>
- On InfoWARE Finance Mobile App ( Android, iPhone & iPad and Windows 10) , "Top Gainers & Losers"
Currency Market
In the currency market, the Naira appreciated 0.19%(2.78) against the Dollar to settle at 1 to 1Investment Insights - Top 5 Gainers YTD
These stocks are the best performers whose price has risen faster than the market as a whole with the best returns year to date. Momentum investors believe that stocks that have outperformed the market will often continue to do so because the factors that caused them to outperform will not suddenly disappear. In addition, other investors seeking to benefit from the stock’s outperformance will often purchase the stock, further bidding its price higher and pushing the stock higher still
For more detailed analysis,
- On InfoWARE Market Data Terminal <T5YTD2> <GO>
- On InfoWARE Finance Mobile App ( Android , iPhone & iPad and Windows 10) , "Research"
NSE: Bull Signal - Price crossed above 15 Day MA
This signal implies these stocks are under buying pressure and the price might continue to rise and therefore positions should be monitored closely. Further suggested analysis include looking at the overall market (ASI) to see if the uptrend is market wide, sector wide or specific to the stock. Portfolio managers tend to use this as a signal to do more research to add to their positions or lock in some profits. Typically further analysis should be done using commands like PC and RV on the InfoWARE Market Data Terminal. Another command is ALERTS to set price triggers for possible exit or entry as necessary
For more detailed analysis,
- On InfoWARE Market Data Terminal <NSEPERF> <GO>
- On InfoWARE Finance Mobile App ( Android , iPhone & iPad and Windows 10) , "Top Gainers & Losers"
| Symbol | Price | %Chg | 15DMA | PE | EPS | DivY | MktCap | Vol | Trades | Value | LstTradeTime |
|---|---|---|---|---|---|---|---|---|---|---|---|
| CHAMPION | 14.00 | 7.50 | 13.71 | 412.83 | 0.01 | 0.41 | 109.61B | 5.90M | 254.00 | 79.78M | 01-Dec-2025 14:30:19.837 |
| GUINEAINS | 1.18 | 6.78 | 1.15 | 66.79 | 0.01 | 1.96 | 7.25B | 1.59M | 72.00 | 1.79M | 01-Dec-2025 14:30:07.707 |
| LINKASSURE | 1.84 | 6.52 | 1.77 | 59.89 | 0.02 | 5.56 | 25.76B | 977.26K | 66.00 | 1.73M | 01-Dec-2025 14:30:09.880 |
| AIICO | 3.52 | 5.97 | 3.39 | 2.01 | 0.60 | 4.13 | 128.85B | 7.20M | 440.00 | 25.06M | 01-Dec-2025 14:30:07.113 |
| TANTALIZER | 2.39 | 5.86 | 2.35 | 0.00 | 0.00 | 1.50 | 7.68B | 6.61M | 158.00 | 15.61M | 01-Dec-2025 14:30:10.390 |
| NGXGROWTH | 14,784.67 | 5.18 | 14,192.93 | 18.83 | 0.18 | 0.00 | 0.00 | 6.59M | 286.00 | 27.25M | 01-Dec-2025 14:30:12.443 |
| VITAFOAM | 87.90 | 5.12 | 86.03 | 8.66 | 2.56 | 7.03 | 109.95B | 1.38M | 218.00 | 117.16M | 01-Dec-2025 14:30:10.623 |
| OMATEK | 1.23 | 4.88 | 1.19 | 6.82 | 0.10 | 0.00 | 3.62B | 2.60M | 135.00 | 3.12M | 01-Dec-2025 14:30:10.180 |
| VSPBONDETF | 215.00 | 2.84 | 210.30 | 0.00 | 0.00 | 1.51K | 4.00 | 302.22K | 01-Dec-2025 14:30:19.990 | ||
| CADBURY | 57.90 | 0.00 | 57.69 | 33.25 | 0.64 | 1.88 | 108.75B | 648.84K | 352.00 | 35.42M | 01-Dec-2025 14:30:07.260 |
| MAYBAKER | 17.05 | 0.00 | 17.04 | 58.94 | 0.14 | 3.75 | 29.42B | 340.71K | 72.00 | 5.57M | 01-Dec-2025 14:30:09.913 |
NSE: BEAR Signal - Price crossed below 15 Day MA
This signal implies these stocks are under selling pressure and the price might continue to slide and therefore positions should be monitored closely. Further suggested analysis include looking at the overall market (ASI) to see if the downtrend is market wide, sector wide or specific to the stock. If the overal market trend is upwards, then since these stocks are heading in the opposite direction, then further analysis should be done using commands like PC and RV on the InfoWARE Market Data Terminal. Another command is ALERTS to set price triggers for possible exit is necessar
For more detailed analysis,
- On InfoWARE Market Data Terminal <BEARM> <GO>
- On InfoWARE Finance Mobile App ( Android , iPhone & iPad and Windows 10)
| Symbol | Price | %Chg | 15DMA | PE | EPS | DivY | MktCap | Vol | Trades | Value | LstTradeTime |
|---|---|---|---|---|---|---|---|---|---|---|---|
| MANSARD | 12.90 | 0.00 | 12.92 | 31.16 | 0.24 | 4.59 | 116.10B | 481.00K | 116.00 | 6.15M | 01-Dec-2025 14:30:09.900 |
| WAPCO | 133.40 | -0.45 | 133.68 | 24.60 | 2.87 | 2.70 | 2,148.78B | 4.50M | 390.00 | 601.54M | 01-Dec-2025 14:30:20.077 |
| FIDELITYBK | 19.00 | -0.53 | 19.01 | 13.24 | 1.17 | 5.48 | 550.52B | 59.87M | 471.00 | 1.14B | 01-Dec-2025 14:30:19.850 |
| VERITASKAP | 1.74 | -2.30 | 1.75 | 48.77 | 0.02 | 4.17 | 24.13B | 4.43M | 114.00 | 7.85M | 01-Dec-2025 14:30:10.600 |
| FGSUK2031S4 | 85.00 | -5.65 | 88.51 | 0.00 | 0.00 | 2.20K | 1.00 | 1.87M | 01-Dec-2025 14:30:22.427 | ||
| CORNERST | 5.53 | -8.50 | 5.93 | 8.62 | 0.35 | 5.28 | 100.46B | 1.62M | 61.00 | 8.98M | 01-Dec-2025 14:30:07.373 |
| LOTUSHAL15 | 74.20 | -10.51 | 81.05 | 0.00 | 0.00 | 18.02K | 29.00 | 1.47M | 01-Dec-2025 14:30:22.303 | ||
| RTBRISCOE | 3.10 | -10.97 | 3.27 | 0.00 | 0.00 | 4.35 | 3.65B | 1.00M | 43.00 | 3.13M | 01-Dec-2025 14:30:10.293 |
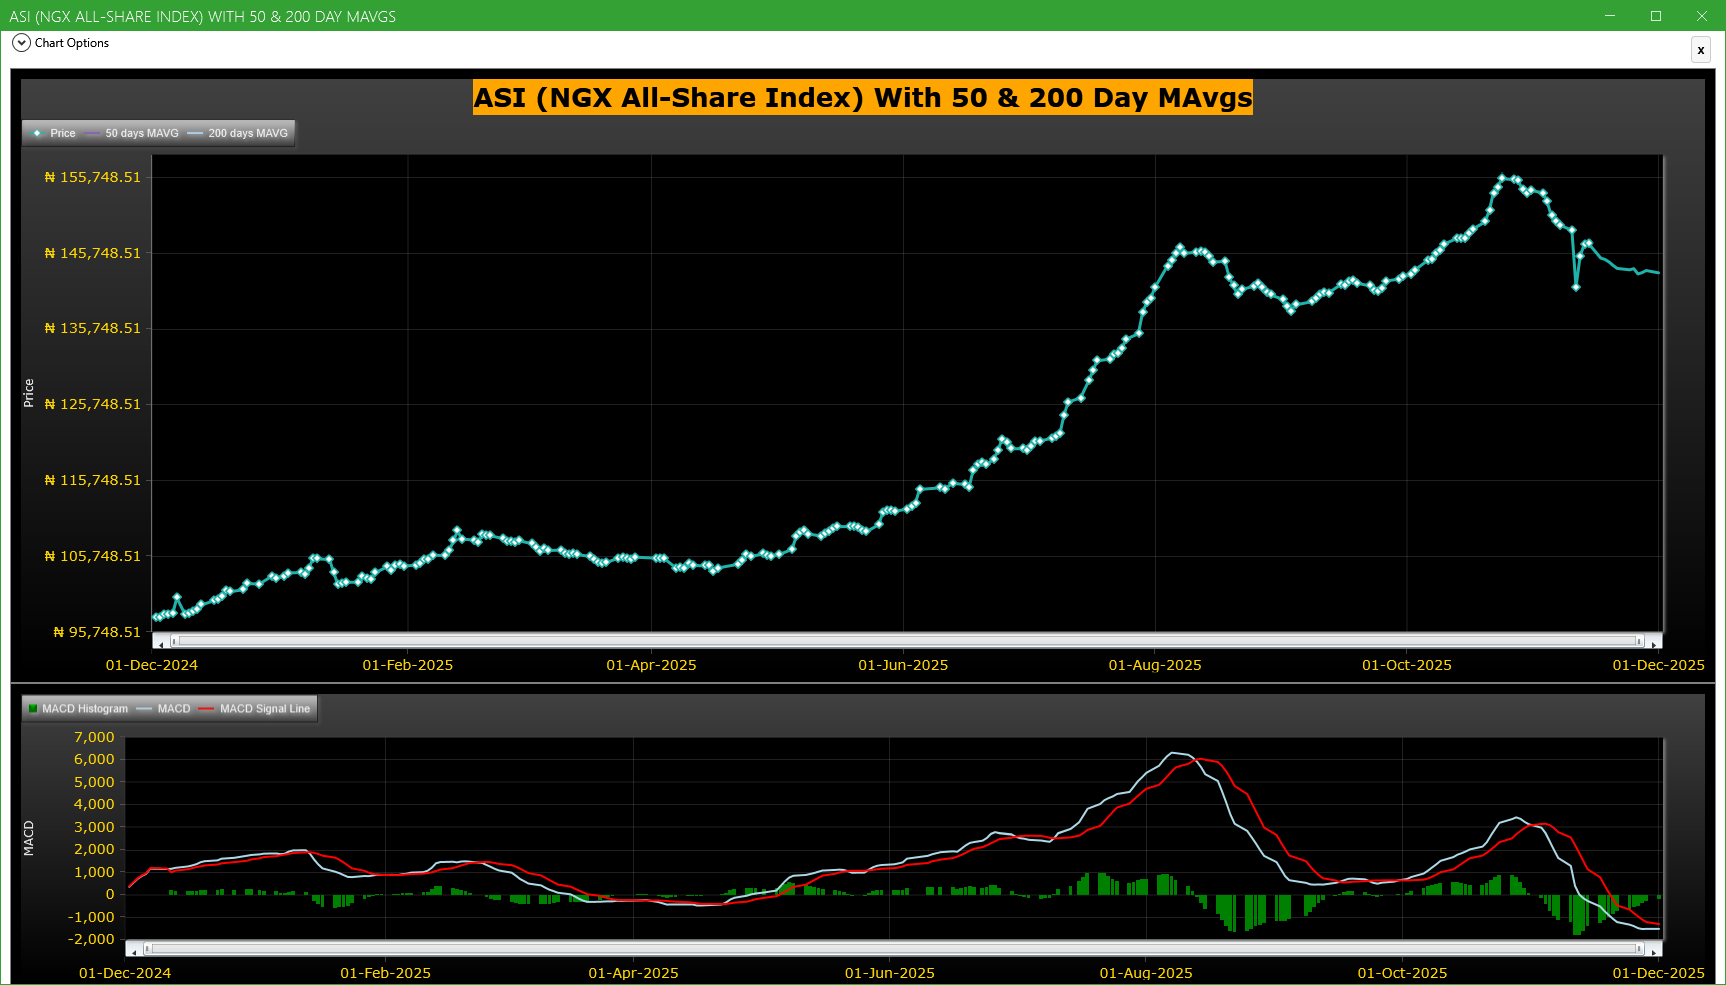
Market Trend - ASI (NGX All-Share-Index) With 50 & 200 Day MAvgs Chart
Technical traders typically use the 50 & 200 day moving averages to aid in choosing
where to enter or exit a position, which then causes these levels to act as strong
support or resistance. As a general guideline, if the price is above a moving average,
the trend is up. If the price is below a moving average, the trend is down.
It is important to note that critics of technical analysis say that moving averages act
as support and resistance because so many traders use these indicators to inform their
trading decisions. Also moving averages tend to work quite well in strong trending conditions
but poorly in choppy or ranging conditions.
Trading Strategies: Crossovers
Crossovers are one of the main moving average strategies. The first type is a price crossover,
which is when the price crosses above or below a moving average to signal a potential change
in trend. Another strategy is to apply two moving averages to a chart: one longer and one
shorter. When the shorter-term MA crosses above the longer-term MA, it is a buy signal, as
it indicates that the trend is shifting up. This is known as a golden cross. Meanwhile, when
the shorter-term MA crosses below the longer-term MA, it is a sell signal, as it indicates that
the trend is shifting down. This is known as a dead/death cross
For more detailed analysis,
- On InfoWARE Market Data Terminal <CI> <GO>
- On InfoWARE Finance Mobile App ( Android , iPhone & iPad and Windows 10) , "Research"
Unusual Volume: Volume traded is more than double the 90 day moving average (All exchanges; ASI & ASem). For more detailed analysis,
- On InfoWARE Market Data Terminal <UV> <GO>
- On InfoWARE Finance Mobile App ( Android , iPhone & iPad and Windows 10)
| Symbol | Name | Volume | 90DAvgVol | %VolChg | Price | LClose | %Chg | Trades | Value |
|---|---|---|---|---|---|---|---|---|---|
| WEMABANK | WEMA BANK PLC. | 113.25M | 12.62M | 797.10 | 18.25 | 18.30 | -0.27 | 357 | 2.07B |
| ACCESSCORP | Access Holdings PLC | 93.92M | 44.04M | 113.26 | 21.00 | 21.00 | 0.00 | 1,560 | 1.97B |
| CUSTODIAN | CUSTODIAN AND ALLIED PLC | 20.61M | 1.77M | 1,064.45 | 39.90 | 39.90 | 0.00 | 154 | 815.11M |
| UCAP | UNITED CAPITAL PLC | 11.03M | 5.02M | 119.93 | 17.30 | 17.35 | -0.29 | 314 | 191.75M |
| CHAMPION | CHAMPION BREW. PLC. | 5.90M | 2.52M | 133.81 | 14.00 | 12.95 | 8.11 | 254 | 79.78M |
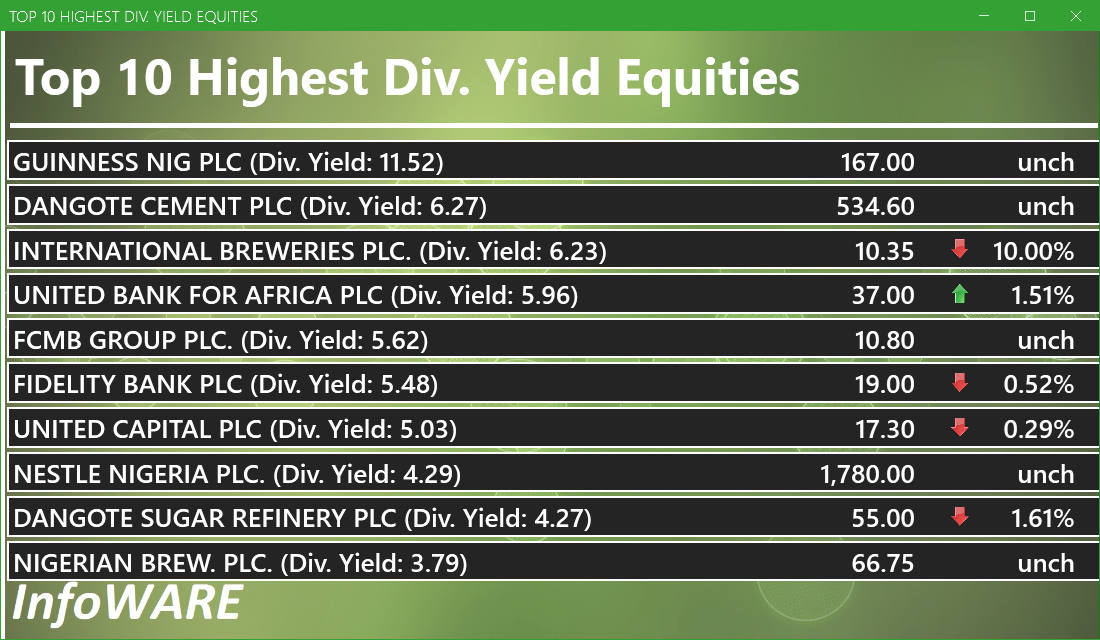
Investment Insights - High Div. Stocks
Dividend stocks distribute a portion of the company earnings to investors on a regular basis and they can a great choice for investors looking for regular income. As an investment or trading strategy, high dividend yield equities provide annual cash payments as against mostly capital gains in the price of a stock. The list in the table below represent the highest dividend paying stocks from the list of the most liquid stocks in the NSE top 30.
For more detailed analysis,
- On InfoWARE Market Data Terminal <HYIELD> <GO>
- On InfoWARE Finance Mobile App ( Android , iPhone & iPad and Windows 10) , "Research"
Investment Insights - Stocks outperforming the ASI but with approximately the same risk
These list of stocks represent equities that are less risky than the ASI but doing better than the ASI (All Shares Index) using the YTD (Year to Date) returns as the measure. The risk is measured by Beta. Beta is an assessment of a stock's tendency to undergo price changes, (its volatility), as well as its potential returns compared to the ASI. It is expressed as a ratio, where a score of 1 represents performance comparable to the ASI, and returns above or below the market may receive scores greater or lower than 1.
For a full list of both positively and negatively corelated stocks visit InfoWARE Market Data Terminal
- On InfoWARE Market Data Terminal <BANL> <GO>
- On InfoWARE Finance Mobile App ( Android , iPhone & iPad and Windows 10)
| Symbol | DivYield | PE | EPS | Beta | %ChgYTD | ASIYTDReturn | BetaDiff |
|---|---|---|---|---|---|---|---|
| HONYFLOUR | 1.40 | 16.28 | 0.31 | 0.99 | 163.73 | 38.80 | 0.01 |
| CAVERTON | 5.52 | 1.15 | 1.57 | 0.98 | 101.96 | 38.80 | 0.02 |
| ROYALEX | 7.81 | 0.00 | 0.00 | 0.96 | 77.27 | 38.80 | 0.04 |
| CORNERST | 5.28 | 8.62 | 0.35 | 0.93 | 39.65 | 38.80 | 0.07 |
| UNIVINSURE | 0.00 | 0.00 | 0.00 | 0.83 | 59.72 | 38.80 | 0.17 |
| FTNCOCOA | 1.60 | 0.00 | 0.00 | 0.79 | 160.64 | 38.80 | 0.21 |
| NB | 3.79 | 16.95 | 1.60 | 0.79 | 108.59 | 38.80 | 0.21 |
| MAYBAKER | 3.75 | 58.94 | 0.14 | 0.78 | 81.38 | 38.80 | 0.22 |
| UNILEVER | 2.81 | 67.09 | 0.40 | 0.75 | 100.00 | 38.80 | 0.25 |
| VETGOODS | 0.00 | 0.71 | 120.93 | 38.80 | 0.29 |
African Markets
| Name | LClose | Change | %Chg |
|---|---|---|---|
| BRVM Stock Exchange | 345.91 | -1.32 | -0.38 |
| Botswana Stock Exchange | 10,705.30 | 26.70 | 0.25 |
| Egyptian Exchange | 40,039.24 | 502.12 | 1.27 |
| Ghana Stock Exchange | 8,610.15 | 25.75 | 0.30 |
| Johannesburg Stock Exchange | 110,958.50 | 387.00 | 0.35 |
| Lusaka Stock Exchange | 25,168.25 | -7.55 | -0.03 |
| Casablanca Stock Exchange | 18,603.59 | -37.28 | -0.20 |
| Malawi Stock Exchange | 619,312.19 | -2,112.85 | -0.34 |
| Nigeria Stock Exchange | 143,520.53 | 286.47 | 0.20 |
| Nairobi Securities Exchange | 181.06 | 0.69 | 0.38 |
| Namibian Stock Exchange | 1,998.49 | 1.20 | 0.06 |
| Rwanda Stock Exchange | 179.20 | 0.00 | 0.00 |
| Tunis Stock Exchange | 13,171.35 | 51.17 | 0.39 |
| Uganda Securities Exchange | 1,546.83 | 2.93 | 0.19 |
Nigeria Market Indexes
| Symbol | LClose | %Chg | WTD% | MTD% | QTD% | YTD% | MktCap | Trades |
|---|---|---|---|---|---|---|---|---|
| ASI | 143,210.33 | -0.22 | 0.00 | 0.00 | 0.16 | 38.80 | 27,153 | |
| NGX30 | 5,237.16 | -0.24 | 0.00 | 0.00 | 0.37 | 37.28 | 15,261 | |
| NGXAFRBVI | 3,113.64 | 0.26 | 0.00 | 0.00 | -12.28 | 25.51 | 5,674 | |
| NGXAFRHDYI | 20,780.03 | 0.07 | 0.00 | 0.00 | -6.65 | 22.04 | 6,308 | |
| NGXASEM | 1,392.88 | 0.00 | 0.00 | 0.00 | -9.44 | -12.05 | 3 | |
| NGXBNK | 1,383.34 | 0.11 | 0.00 | 0.00 | -8.80 | 27.21 | 6,280 | |
| NGXCG | 3,838.76 | 0.03 | 0.00 | 0.00 | -5.24 | 35.68 | 13,842 | |
| NGXCNSMRGDS | 3,386.47 | -1.01 | 0.00 | 0.00 | 0.11 | 95.26 | 3,542 | |
| NGXCOMMDTY | 1,181.51 | -0.06 | 0.00 | 0.00 | 5.32 | 18.15 | ||
| NGXGROWTH | 14,784.67 | 5.46 | 0.00 | 0.00 | -1.91 | 90.45 | 286 | |
| NGXINDUSTR | 5,129.85 | -0.07 | 0.00 | 0.00 | 1.22 | 43.63 | 2,258 | |
| NGXINS | 1,083.77 | 0.10 | 0.00 | 0.00 | -9.39 | 37.85 | 1,727 | |
| NGXLOTUSISLM | 12,761.09 | -0.14 | 0.00 | 0.00 | 7.50 | 83.14 | 5,709 | |
| NGXMAINBOARD | 6,985.31 | -0.36 | 0.00 | 0.00 | -0.84 | 39.60 | 19,075 | |
| NGXMERIGRW | 9,963.35 | -0.06 | 0.00 | 0.00 | 0.61 | 52.74 | 4,066 | |
| NGXMERIVAL | 12,315.65 | 0.20 | 0.00 | 0.00 | -7.87 | 18.07 | 7,200 | |
| NGXOILGAS | 2,696.35 | -0.11 | 0.00 | 0.00 | 6.74 | -0.55 | 460 | |
| NGXPENBRD | 2,694.35 | -0.02 | 0.00 | 0.00 | 1.63 | 47.10 | 22,308 | |
| NGXPENSION | 6,621.06 | -0.02 | 0.00 | 0.00 | -1.73 | 46.03 | 17,055 | |
| NGXPREMIUM | 14,085.55 | 0.04 | 0.00 | 0.00 | 2.88 | 44.72 | 7,792 | |
| NGXSOVBND | 673.45 | 0.08 | 0.00 | 0.00 | 2.46 | 11.95 | 2 |
For more detailed analysis,
- On InfoWARE Market Data Terminal <MKTINS> <GO>
- On InfoWARE Finance Mobile App ( Android, iPhone & iPad and Windows 10) , "Market Indexes"
Find the topic interesting? Will like to comment? Contact Us at solutions@infowarelimited.com
Top News

Chart Of The Day - ASI Chart Vs ASI Advance Decline Line (YTD) (01-Dec-2025 15:06:56.747)
InfoWARE AI Analyst Daily Market Report: 01-Dec-2025

[SIAMLETF40]>> DAILY INDICATIVE PRICES
[VETGOODS]>> DAILY INDICATIVE PRICES
[XNSA]>> OFF MARKET TRADE
[XNSA]>> EMERGING AFRICA DAILY MUTUAL FUND PRICES
[XNSA]>> H2 2025 BC/DR TEST
[XNSA]>>GO-LIVE NOTIFICATION: TRANSITION TO T+2 SETTLEMENT CYCLE
InfoWARE AI Analyst Weekly Market Report: 28-Nov-2025
Chart Of The Day - ASI Chart Vs ASI Advance Decline Line (YTD) (28-Nov-2025 15:06:42.196)
InfoWARE AI Analyst Daily Market Report: 28-Nov-2025
Breaking News! Unusual Volume Alert (28-Nov-2025 14:21:07.760)
Breaking News! Bulls Momentum Alert (28-Nov-2025 14:21:06.675)
Breaking News! Bears Momentum Alert (28-Nov-2025 14:21:06.590)
[XNSA]>> OFF MARKET TRADE
[XNSA]>> IMPERIAL ASSET MANAGERS LIMITED - APPOINTMENT OF DIRECTORS
[XNSA]>> OFF MARKET TRADE
[XNSA]>> DAILY FUND PRICE SUBMISSION - FCMB ASSET MANAGEMENT LIMITED
[XNSA]>> NORRENBERGER MUTUAL FUNDS WEEKLY UPDATE
[XNSA]>> VFD GROUP PLC: EXTENSION FOR TRADING IN RIGHTS ISSUE
[SIAMLETF40]>> DAILY INDICATIVE PRICES
[VSPBONDETF]>> DAILY INDICATIVE PRICES
[XNSA]>> CORDROS MILESTONE FUNDS' BID & OFFER PRICES
[XNSA]>> H2 2025 BC/DR TEST
[XNSA]>>GO-LIVE NOTIFICATION: TRANSITION TO T+2 SETTLEMENT CYCLE
Chart Of The Day - ASI Chart Vs ASI Advance Decline Line (YTD) (27-Nov-2025 15:10:19.888)
InfoWARE AI Analyst Daily Market Report: 27-Nov-2025
[XNSA]>> CORDROS MILESTONE FUNDS' BID & OFFER PRICES
[XNSA]>> DAILY FUND PRICE SUBMISSION - FCMB ASSET MANAGEMENT LIMITED
[VSPBONDETF]>> DAILY INDICATIVE PRICES
Get IDIA - the stock trading app for the modern investor
Solutions by Business
Product Suites
Company
Contacts
- 8th Floor,
- South Atlantic Petroleum Towers,
- 1 Adeola Odeku Street,
- Victoria Island,
- Lagos, Nigeria.
- Email: solutions@infowarelimited.com
Follow Us
 |
 |
 |
 |