


InfoWARE AI Analyst Daily Market Report: 25-Jun-2025 | InfoWARE Finance
Get IDIA - the stock trading app for the modern investor


InfoWARE AI Analyst Daily Market Report: 25-Jun-2025
(Source: InfoWARE Terminal, Date: 25-Jun-2025)
Dear Investor,
NGX Daily Market Summary – Wednesday, June 25, 2025
The NGX All Share Index (ASI) bounced back with a robust +1.22% rally to close at 119,790.82, reversing the previous session’s losses. Year-to-date (YTD), the ASI is now up +17.52%. Market turnover surged by +9.44% to ₦23.35B, fueled by heightened institutional activity and broad-based advances. With market breadth healthy at 3.14x (66 advancers vs. 21 decliners), buyers maintained firm control. Volume increased significantly to 830.88 million shares, up from yesterday’s 731.08 million, with 65 stocks seeing volume upticks. Notably, bullish momentum stocks like CHAMPION, NEIMETH, and BETA GLASS powered further ahead; yet, market action was punctuated by extremes as DANGSUGAR and MERVALUE exhibited sharp moves.
1️⃣ Significant Trends in Market Breadth
- Bullish breadth: 66 advancers vs 21 decliners, market breadth at 3.14x – signals strong positive sentiment.
- Volume expansion: Volume traded up in 65 companies, down in 76; suggests selective rotation with institutional flows targeting specific names.
- Turnover climbed +9.44% while trade deals stayed elevated at 21,299 – institutions are increasingly active, especially on big caps.
2️⃣ Highlights: Top Gainers & Losers
Top Gainers of the Day
| Symbol | Name | Change (%) | Price (₦) | RSI | MACD |
|---|---|---|---|---|---|
| DANGSUGAR | DANGOTE SUGAR REFINERY PLC | +10.00% | 48.40 | 68.00 | 0.84 |
| OANDO | OANDO PLC | +10.00% | 68.75 | 59.16 | 4.19 |
| MERVALUE | MERISTEM VALUE ETF | +10.00% | 128.70 | 37.01 | -1.75 |
| CHAMPION | CHAMPION BREW. PLC. | +9.98% | 10.91 | 81.55 | 0.74 |
| CILEASING | C & I LEASING PLC. | +9.98% | 5.18 | 59.52 | 0.10 |
Top Losers of the Day
| Symbol | Name | Change (%) | Price (₦) | RSI | MACD |
|---|---|---|---|---|---|
| UPL | UNIVERSITY PRESS PLC | -6.25% | 6.00 | 63.85 | 0.42 |
| RTBRISCOE | R T BRISCOE PLC | -6.12% | 2.30 | 57.76 | 0.06 |
| LOTUSHAL15 | LOTUS HALAL ETF | -5.71% | 33.00 | 51.40 | -1.01 |
| MULTIVERSE | MULTIVERSE PLC | -4.89% | 8.75 | 51.70 | 0.19 |
| MEYER | MEYER PLC. | -4.69% | 9.15 | 59.83 | 0.09 |
- CHAMPION maintained its leadership in momentum with an RSI of 81.55, flagging overbought conditions but showing no signs of immediate reversal. Note: its MACD remains bullish.
- MERVALUE notched a +10% jump but its RSI is just 37. A possible technical bounce or rebound after being sold down, but MACD remains negative.
- RTBRISCOE is both a daily and YTD loser, cementing persistent weakness and now confirmed with a bearish 15DMA crossover.
3️⃣ Insights & Market Predictions
- Turnover surge (+9.44%) and volume breakout (up 100M vs prior day), with institutions accounting for ~92% of trade value and 70% of volume, indicate strong conviction and sets a bullish context ahead.
- Market Breadth: Strong advances over decliners reinforce likely continuation of the uptrend in the short-term, especially as key banking and consumer names participate.
- Unusual Volume: Massive surges in volume for CAVERTON (+1,441% above 90D average), ZENITHBANK (+107%), and CADBURY (+1,529%) flag fresh institutional interest—watch these names for follow-through.
-
Bullish Momentum Standouts (RSI above 70 + MACD crossovers):
- CHAMPION, NEIMETH, BETA GLASS - all have strong price run-ups, high RSI, and positive MACD, signaling overbought but not reversed.
- ELLAHLAKES and FTNCOCOA also at extreme momentum, both with over +120% quarterly gains.
- Bearish Momentum: RTBRISCOE crossed below its 15DMA, both a daily and YTD loser, reinforced by negative momentum and lack of recovery buying.
- YTD Top Gainers Table: Market rally is increasingly concentrated: CHAMPION (+186%), BETA GLASS (+415%), LIVESTOCK (+121%), ELLAHLAKES (+135%), and UPDC (+109%)—but several (CHAMPION, NEIMETH) are approaching extremely overbought RSI readings.
- YTD Top Losers Table: Mostly small/mid-caps: DAARCOMM (-13%), ARADEL (-14%), RTBRISCOE (-16%). Persistent losers are generally not seeing technical reversals.
- Dividend Plays: UPDC still yields a staggering 34.2%, signaling potential for income-oriented strategies—yet watch liquidity and price volatility.
4️⃣ Contrarian Signals
- MERVALUE: Notched a +10% gain with an RSI of 37 and negative MACD. Despite today's bounce, the lack of technical confirmation could mean a bear market rally or one-off order flow, rather than sustained momentum.
- CHAMPION: Despite persistent momentum (RSI 81.5, strong MACD), YTD PE remains extremely elevated at 412.8x. Caution is advised—room for further upside exists, but risk of sharp reversal is high.
- RTBRISCOE: Even though not strictly oversold by RSI, it is a loser across daily and YTD, and has now triggered a bearish 15DMA cross; contrarians could watch for short-term bounce setups.
- DANGSUGAR: Strong daily move (+10%, RSI 68), yet YTD gain is lower than some peers—possibly late-cycle participation within the sector, watch for exhaustion.
5️⃣ Sector Heatmaps & Institutional/Retail Activity
Sector Performance Table
| Sector | Key Movers | Price Change (%) | Institutional Focus | Technical Momentum |
|---|---|---|---|---|
| Banking | ZENITHBANK, UBA, GTCO | +4–9% | High (ZENITHBANK: 20.2% Inst. trade share) | ZENITH (Volume Breakout, MACD bullish), UBA (15DMA cross, high Div. Yield) |
| Insurance | CONHALLPLC, VERITASKAP, UNIVINSURE | +3–9% / -4% | Moderate | VERITASKAP (15DMA cross above, MACD positive), CONHALLPLC (Bearish break below 15DMA) |
| Beverages | CHAMPION, NB | +10% / +1% | Low-to-moderate | CHAMPION (High RSI, all-time highs) |
| ETF | MERVALUE, LOTUSHAL15 | +10% / -5.7% | Low | MERVALUE (Bounce but weak technicals) |
6️⃣ Dividend-Beta Matrix: Defensive Opportunities
| Symbol | Dividend Yield (%) | Beta | Momentum Table |
|---|---|---|---|
| UPDC | 34.25 | 1.10 | YTD Gainer |
| NEIMETH | 3.38 | 0.25 | YTD Gainer, Bullish |
| BETA GLASS | 2.42 | 0.09 | YTD Gainer, Bullish |
| LIVESTOCK | 2.94 | 0.46 | YTD Gainer |
| ZENITHBANK | 2.25 | 1.20 | Volume Breakout, Institution-Heavy |
| AFRIPRUD | 1.27 | 0.64 | - |
- UPDC and NEIMETH are high-dividend stocks within the top bullish momentum—attractive for income-seeking traders, especially given their defensive Beta readings less than 1.
- ZENITHBANK combines high institutional interest, strong technicals and above market yield—a blend of growth and defense.
7️⃣ Institutional Clustering Alerts
- ZENITHBANK: Accounts for 20.17% of total institutional trade value—confirms significant buy-side interest. Strong volume surge today.
- CADBURY: Appears in top institutional traded names with a +9.92% move and massive volume breakout, possible block trades or strategic accumulation.
- Institutional volumes are markedly concentrated in banking/financials, suggesting sector rotation towards perceived stability and growth.
8️⃣ High Dividend Yield & Momentum Crossovers
- UPDC: Outlier with 34% yield and strong YTD/Momentum table presence—unique among income stocks, but price volatility presents caution.
- NEIMETH: 3.38% yield, also in top bullish table; supports thesis for combined growth and income strategies.
- VERITASKAP (4.17% yield, recent 15DMA breakout): Could appeal to both momentum and dividend income investors.
9️⃣ Trader Suggestions
- Momentum traders: Favor stocks with high RSI and price crossing above 15DMA (e.g., CHAMPION, NEIMETH, BETAGLAS) but consider trimming or stop-loss given extreme overbought conditions.
- Value/dividend seekers: Look into UPDC, NEIMETH and ZENITHBANK for yield and defensive Beta.
- Contrarians/mean-reversion: Watch MERVALUE and RTBRISCOE for price stabilization or technical bounce opportunities; monitor volume for entry confirmation.
- ETFs: Mixed signals, as LOTUSHAL15 dropped -5.71% while MERVALUE rebounded +10%. Examine underlying assets for trend clarity.
- Watch: For names with high institutional clustering (especially in banking), as further accumulation can catalyze continued outperformance.
🔟 YTD Top Performers & Losers (Wednesday Table)
| YTD Top 5 Gainers | |||||
|---|---|---|---|---|---|
| Symbol | Name | YTD % Chg | Div. Yield (%) | RSI | 5-day % Chg |
| BETAGLAS | BETA GLASS CO PLC | +414.56 | 2.42 | 85.85 | 20.99 |
| CHAMPION | CHAMPION BREW. PLC. | +186.35 | 0.41 | 81.55 | 33.05 |
| LIVESTOCK | LIVESTOCK FEEDS PLC. | +121.22 | 2.94 | 54.55 | 20.99 |
| ELLAHLAKES | ELLAH LAKES PLC. | +135.22 | 0.00 | 85.21 | 32.83 |
| UPDC | UPDC PLC | +108.67 | 34.25 | 64.54 | 20.33 |
| YTD Top 5 Losers | |||||
|---|---|---|---|---|---|
| Symbol | Name | YTD % Chg | Div. Yield (%) | RSI | 5-day % Chg |
| RTBRISCOE | R T BRISCOE PLC | -16.36 | 4.35 | 57.76 | -4.17 |
| DAARCOMM | DAAR COMMUNICATIONS PLC | -13.24 | 0.00 | 41.90 | -9.23 |
| ARADEL | ARADEL HOLDINGS PLC | -13.96 | 1.72 | 49.69 | -4.15 |
| IMG | IND. & MED. GASES NIG PLC | -11.99 | 1.32 | 40.66 | -4.30 |
| MEYER | MEYER PLC. | +8.54 | 3.91 | 59.83 | -4.69 |
- Market leadership remains extremely concentrated; top gainers possess high momentum and, in some cases, above-average dividends, like UPDC and NEIMETH.
- RTBRISCOE is deeply negative YTD—latest daily losses likely to keep it under pressure.
1️⃣1️⃣ Market Activity/Trades Summary Analysis
- Institutional vs. Retail: Institutional investors dominated total volume (70%) and value (91.5%) despite accounting for just 38% of trade count—implying they are executing larger block trades, mainly in banks and blue chips.
- Top 5 Institutional Trades: ZENITHBANK, ACCESSCORP, UBA, GTCO, CADBURY – all large caps, all with recent technical breakouts. Notably, ZENITHBANK outpaced its 90-day volume by +107%, reinforcing concentration of flows and likely further price appreciation if momentum persists.
- Top 5 Retail Trades: ACCESSCORP, ZENITHBANK, UBA, GTCO, MTNN. Pattern closely tracks institutional trades, but retail volumes are far smaller; demonstrates herding but without the same impact.
- Technical/Volume Correlation: Stocks registering as most-traded (ZENITHBANK, ACCESSCORP, UBA, GTCO) also appear as momentum favorites with bullish signals—likely to remain market drivers.
- Hidden Insight: Watch for stocks with strong institutional clustering and high unusual volume—often early indicators of trend persistence or impending revaluations.
1️⃣2️⃣ Key Hidden Trends & Competitive Edge Insights
- Sectoral Rotation: Institutions are clearly ramping exposure in banks and quality blue chips—be agile and piggyback these flows if liquidity allows.
- Momentum + Dividend "Sweet Spot”: Stocks like NEIMETH, ZENITHBANK and UPDC offer both yield and momentum—a prime hunting ground for balanced strategies.
- Beware of "late-cycle” movers: DANGSUGAR is surging, but may be in the latter stage of its run (RSI near 70, already up YTD)—monitor for reversal signals.
- Persistent Weakness: RTBRISCOE and DAARCOMM show no technical reversal, suggesting further downside or dead money.
- Institutional Activity as a Predictor: Large surges in specific names (ZENITHBANK, CADBURY) have historically preceded further outperformance.
- Mean Reversion Opportunities: Names like MERVALUE with high daily gains but negative MACD/low RSI are contrarian setups—await price confirmation.
Summary
Today’s NGX session confirmed intensifying bullish sentiment, driven by a fresh wave of institutional buying into large-cap banks and select momentum favorites. With multiple stocks flashing overbought conditions (CHAMPION, BETAGLAS, ELLAHLAKES), traders should combine trailing stop-loss methods with opportunistic riding of winner trends. Meanwhile, attention to defensive dividend-momentum hybrids (UPDC, NEIMETH, ZENITHBANK) could provide a sturdy middle ground. Persistent laggards like RTBRISCOE give no reversal signals and can be avoided for now. As breadth and flows remain wide and robust, near-term outlook stays positive—but expect profit taking and sharp rotations in overextended names.
Action Point: Engage rising stars with momentum (but manage risk!), ride institutional favorites, and scan for defensive dividend standouts for portfolio stability.
|
Top ASI Gainers Over Last 5 Trading Days
|
Top ASI Losers Over Last 5 Trading Days
|
For more detailed analysis, on InfoWARE Market Data Terminal <NSEPERF> <GO>
On InfoWARE Finance Mobile App (Android, iPhone & iPad, Windows Phone and Windows 8/10), "Top Gainers & Losers"
MERISTEM VALUE EXCHANGE TRADED FUND (MERVALUE) topped the advancers list closing at N128.70 with a gain of 10.00% followed by DANGOTE SUGAR REFINERY PLC (DANGSUGAR) which closed at N48.40 with a gain of 10.00%.
On the flip side UNIVERSITY PRESS PLC. (UPL) and R T BRISCOE PLC. (RTBRISCOE) topped the decliners log with a loss of -6.25% at a close of N6.00, and -6.12% to close the day at N2.30 respectively.
| Symbol | LClose | %Chg |
|---|---|---|
| MERVALUE | 128.70 | 10.00 |
| DANGSUGAR | 48.40 | 10.00 |
| OANDO | 68.75 | 10.00 |
| CHAMPION | 10.91 | 9.98 |
| CILEASING | 5.18 | 9.98 |
| Symbol | LClose | %Chg |
|---|---|---|
| UPL | 6.00 | -6.25 |
| RTBRISCOE | 2.30 | -6.12 |
| LOTUSHAL15 | 33.00 | -5.71 |
| MULTIVERSE | 8.75 | -4.89 |
| MEYER | 9.15 | -4.69 |
For more detailed analysis,
- On InfoWARE Market Data Terminal <TOPG> <GO>
- On InfoWARE Finance Mobile App ( Android, iPhone & iPad and Windows 10) , "Top Gainers & Losers"
Currency Market
In the currency market, the Naira was unchanged against the dollar at 1 to 1NSE: Bull Signal - Price crossed above 15 Day MA
This signal implies these stocks are under buying pressure and the price might continue to rise and therefore positions should be monitored closely. Further suggested analysis include looking at the overall market (ASI) to see if the uptrend is market wide, sector wide or specific to the stock. Portfolio managers tend to use this as a signal to do more research to add to their positions or lock in some profits. Typically further analysis should be done using commands like PC and RV on the InfoWARE Market Data Terminal. Another command is ALERTS to set price triggers for possible exit or entry as necessary
For more detailed analysis,
- On InfoWARE Market Data Terminal <NSEPERF> <GO>
- On InfoWARE Finance Mobile App ( Android , iPhone & iPad and Windows 10) , "Top Gainers & Losers"
| Symbol | Price | %Chg | 15DMA | PE | EPS | DivY | MktCap | Vol | Trades | Value | LstTradeTime |
|---|---|---|---|---|---|---|---|---|---|---|---|
| MERVALUE | 128.70 | 9.09 | 120.71 | 0.00 | 0.00 | 50.00 | 4.00 | 6.44K | 25-Jun-2025 14:30:50.900 | ||
| NCR | 6.00 | 8.33 | 5.69 | 0.00 | 0.00 | 61.22 | 648.00M | 155.00K | 9.00 | 929.98K | 25-Jun-2025 14:30:16.667 |
| NPFMCRFBK | 2.14 | 5.14 | 2.07 | 5.63 | 0.27 | 8.00 | 12.82B | 3.84M | 64.00 | 8.21M | 25-Jun-2025 14:30:16.900 |
| VERITASKAP | 1.03 | 4.85 | 1.00 | 48.77 | 0.02 | 4.17 | 14.28B | 9.33M | 124.00 | 9.26M | 25-Jun-2025 14:30:18.440 |
| UBA | 36.30 | 4.13 | 35.09 | 8.29 | 4.05 | 5.96 | 1,241.44B | 25.32M | 899.00 | 908.39M | 25-Jun-2025 14:30:52.840 |
| CHAMS | 2.25 | 4.00 | 2.20 | 27.02 | 0.07 | 1.56 | 10.57B | 14.17M | 244.00 | 30.96M | 25-Jun-2025 14:30:50.330 |
| ABCTRANS | 2.69 | 3.35 | 2.65 | 6.68 | 0.17 | 2.19 | 6.44B | 3.80M | 104.00 | 9.41M | 25-Jun-2025 14:30:10.493 |
| NSLTECH | 0.60 | 3.33 | 0.59 | 0.00 | 0.00 | 15.87 | 3.38B | 3.16M | 33.00 | 1.86M | 25-Jun-2025 14:30:16.927 |
| SUNUASSUR | 5.11 | 2.15 | 5.09 | 0.00 | 0.00 | 0.99 | 29.69B | 2.90M | 60.00 | 14.59M | 25-Jun-2025 14:30:50.560 |
| MCNICHOLS | 2.35 | 2.13 | 2.33 | 26.80 | 0.05 | 5.88 | 1.69B | 2.33M | 87.00 | 5.35M | 25-Jun-2025 14:30:54.280 |
NSE: BEAR Signal - Price crossed below 15 Day MA
This signal implies these stocks are under selling pressure and the price might continue to slide and therefore positions should be monitored closely. Further suggested analysis include looking at the overall market (ASI) to see if the downtrend is market wide, sector wide or specific to the stock. If the overal market trend is upwards, then since these stocks are heading in the opposite direction, then further analysis should be done using commands like PC and RV on the InfoWARE Market Data Terminal. Another command is ALERTS to set price triggers for possible exit is necessar
For more detailed analysis,
- On InfoWARE Market Data Terminal <BEARM> <GO>
- On InfoWARE Finance Mobile App ( Android , iPhone & iPad and Windows 10)
| Symbol | Price | %Chg | 15DMA | PE | EPS | DivY | MktCap | Vol | Trades | Value | LstTradeTime |
|---|---|---|---|---|---|---|---|---|---|---|---|
| CONHALLPLC | 3.00 | -4.33 | 3.01 | 69.63 | 0.03 | 2.08 | 32.11B | 7.11M | 173.00 | 21.55M | 25-Jun-2025 14:30:11.417 |
| RTBRISCOE | 2.30 | -6.52 | 2.35 | 0.00 | 0.00 | 4.35 | 2.71B | 1.75M | 65.00 | 4.20M | 25-Jun-2025 14:30:17.540 |
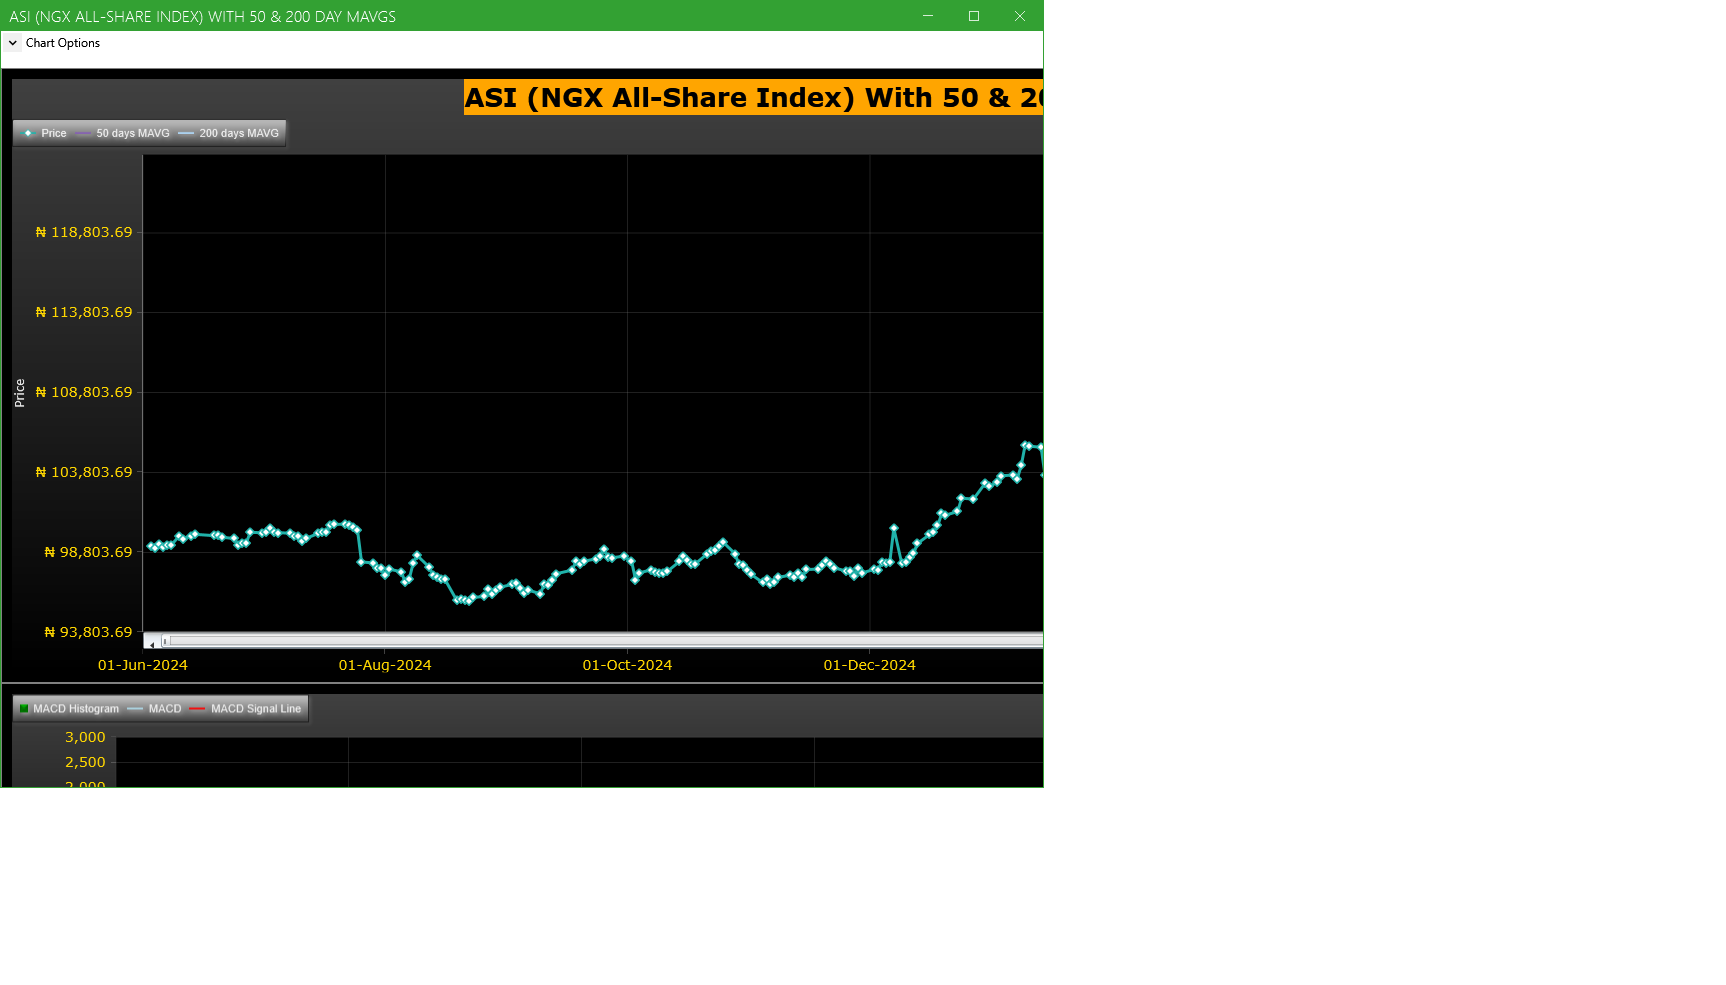
Market Trend - ASI (NGX All-Share-Index) With 50 & 200 Day MAvgs Chart
Technical traders typically use the 50 & 200 day moving averages to aid in choosing
where to enter or exit a position, which then causes these levels to act as strong
support or resistance. As a general guideline, if the price is above a moving average,
the trend is up. If the price is below a moving average, the trend is down.
It is important to note that critics of technical analysis say that moving averages act
as support and resistance because so many traders use these indicators to inform their
trading decisions. Also moving averages tend to work quite well in strong trending conditions
but poorly in choppy or ranging conditions.
Trading Strategies: Crossovers
Crossovers are one of the main moving average strategies. The first type is a price crossover,
which is when the price crosses above or below a moving average to signal a potential change
in trend. Another strategy is to apply two moving averages to a chart: one longer and one
shorter. When the shorter-term MA crosses above the longer-term MA, it is a buy signal, as
it indicates that the trend is shifting up. This is known as a golden cross. Meanwhile, when
the shorter-term MA crosses below the longer-term MA, it is a sell signal, as it indicates that
the trend is shifting down. This is known as a dead/death cross
For more detailed analysis,
- On InfoWARE Market Data Terminal <CI> <GO>
- On InfoWARE Finance Mobile App ( Android , iPhone & iPad and Windows 10) , "Research"
Unusual Volume: Volume traded is more than double the 90 day moving average (All exchanges; ASI & ASem). For more detailed analysis,
- On InfoWARE Market Data Terminal <UV> <GO>
- On InfoWARE Finance Mobile App ( Android , iPhone & iPad and Windows 10)
| Symbol | Name | Volume | 90DAvgVol | %VolChg | Price | LClose | %Chg | Trades | Value |
|---|---|---|---|---|---|---|---|---|---|
| CAVERTON | CAVERTON OFFSHORE SUPPORT GRP PLC | 64.18M | 4.16M | 1,441.81 | 5.00 | 4.93 | 1.42 | 290 | 319.69M |
| ZENITHBANK | ZENITH INTERNATIONAL BANK PLC | 60.62M | 29.28M | 107.08 | 58.00 | 53.00 | 9.43 | 1,408 | 3.45B |
| JAPAULGOLD | JAPAUL GOLD & VENTURES PLC | 56.26M | 10.85M | 418.42 | 2.05 | 1.99 | 3.02 | 157 | 115.35M |
| NB | NIGERIAN BREW. PLC. | 32.10M | 11.95M | 168.67 | 59.00 | 58.35 | 1.11 | 236 | 1.89B |
| UNIVINSURE | UNIVERSAL INSURANCE COMPANY PLC | 30.33M | 13.13M | 131.02 | 0.60 | 0.55 | 9.09 | 115 | 18.06M |
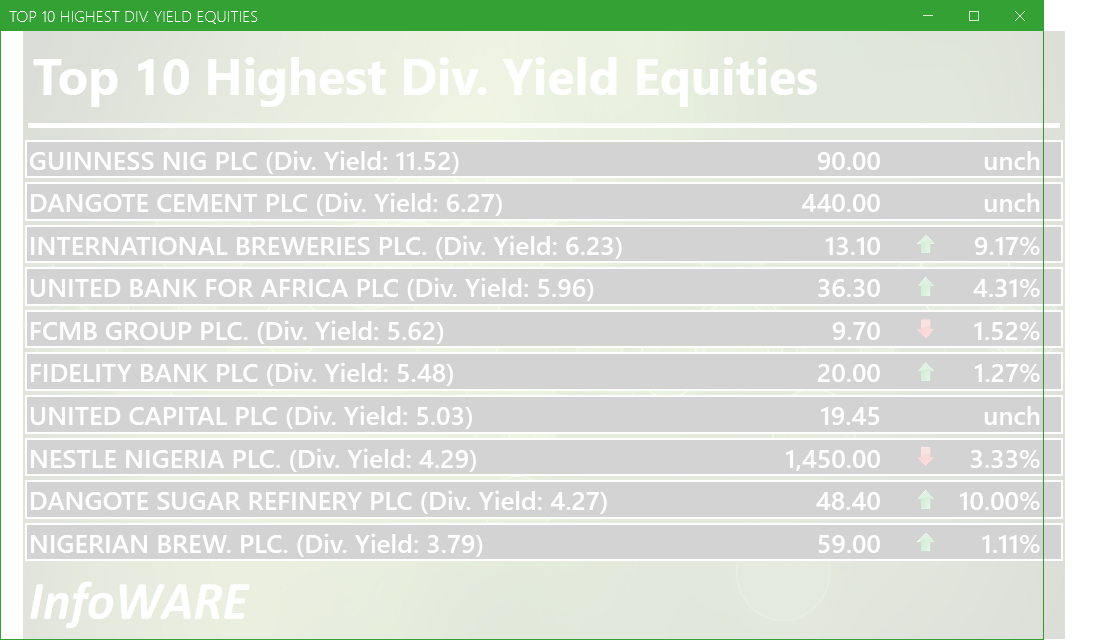
Investment Insights - High Div. Stocks
Dividend stocks distribute a portion of the company earnings to investors on a regular basis and they can a great choice for investors looking for regular income. As an investment or trading strategy, high dividend yield equities provide annual cash payments as against mostly capital gains in the price of a stock. The list in the table below represent the highest dividend paying stocks from the list of the most liquid stocks in the NSE top 30.
For more detailed analysis,
- On InfoWARE Market Data Terminal <HYIELD> <GO>
- On InfoWARE Finance Mobile App ( Android , iPhone & iPad and Windows 10) , "Research"
Investment Insights - Stocks outperforming the ASI but with approximately the same risk
These list of stocks represent equities that are less risky than the ASI but doing better than the ASI (All Shares Index) using the YTD (Year to Date) returns as the measure. The risk is measured by Beta. Beta is an assessment of a stock's tendency to undergo price changes, (its volatility), as well as its potential returns compared to the ASI. It is expressed as a ratio, where a score of 1 represents performance comparable to the ASI, and returns above or below the market may receive scores greater or lower than 1.
For a full list of both positively and negatively corelated stocks visit InfoWARE Market Data Terminal
- On InfoWARE Market Data Terminal <BANL> <GO>
- On InfoWARE Finance Mobile App ( Android , iPhone & iPad and Windows 10)
| Symbol | DivYield | PE | EPS | Beta | %ChgYTD | ASIYTDReturn | BetaDiff |
|---|---|---|---|---|---|---|---|
| HONYFLOUR | 1.40 | 16.28 | 0.31 | 0.99 | 212.14 | 17.52 | 0.01 |
| CAVERTON | 5.52 | 1.15 | 1.57 | 0.98 | 96.08 | 17.52 | 0.02 |
| FIDELITYBK | 5.48 | 13.24 | 1.17 | 0.89 | 17.65 | 17.52 | 0.11 |
| FTNCOCOA | 1.60 | 0.00 | 0.00 | 0.79 | 97.34 | 17.52 | 0.21 |
| NB | 3.79 | 16.95 | 1.60 | 0.79 | 84.38 | 17.52 | 0.21 |
| MAYBAKER | 3.75 | 58.94 | 0.14 | 0.78 | 69.68 | 17.52 | 0.22 |
| UNILEVER | 2.81 | 67.09 | 0.40 | 0.75 | 30.56 | 17.52 | 0.25 |
| VETGOODS | 0.00 | 0.71 | 49.71 | 17.52 | 0.29 | ||
| CUTIX | 6.52 | 8.81 | 0.26 | 0.70 | 26.48 | 17.52 | 0.30 |
| Ikejahotel | 0.94 | 51.55 | 0.16 | 0.70 | 26.32 | 17.52 | 0.30 |
African Markets
| Name | LClose | Change | %Chg |
|---|---|---|---|
| BRVM Stock Exchange | 311.92 | -0.50 | -0.16 |
| Botswana Stock Exchange | 10,374.92 | 23.81 | 0.23 |
| Egyptian Exchange | 31,418.74 | 363.35 | 1.17 |
| Johannesburg Stock Exchange | 95,887.06 | 761.01 | 0.80 |
| Lusaka Stock Exchange | 20,579.11 | -45.37 | -0.22 |
| Casablanca Stock Exchange | 18,224.19 | 470.47 | 2.65 |
| Malawi Stock Exchange | 312,620.51 | 1,988.05 | 0.64 |
| Nairobi Securities Exchange | 147.49 | 1.73 | 1.19 |
| Namibian Stock Exchange | 1,767.84 | 50.49 | 2.94 |
| Rwanda Stock Exchange | 150.49 | 0.00 | 0.00 |
| Tunis Stock Exchange | 11,386.45 | 64.53 | 0.57 |
Nigeria Market Indexes
| Symbol | LClose | %Chg | WTD% | MTD% | QTD% | YTD% | MktCap | Trades |
|---|---|---|---|---|---|---|---|---|
| ASI | 121,257.69 | 1.22 | 2.26 | 8.24 | 14.88 | 17.52 | 21,299 | |
| NGX30 | 4,479.70 | 1.19 | 2.46 | 8.41 | 14.30 | 17.43 | 11,233 | |
| NGXAFRBVI | 3,032.48 | 3.19 | 4.58 | 15.42 | 13.87 | 22.24 | 4,541 | |
| NGXAFRHDYI | 19,800.59 | 2.57 | 3.30 | 7.51 | 18.97 | 16.29 | 5,012 | |
| NGXASEM | 1,593.40 | 0.00 | 0.00 | 0.00 | 0.35 | 0.61 | 21 | |
| NGXBNK | 1,312.05 | 2.38 | 3.34 | 12.83 | 13.03 | 20.66 | 4,911 | |
| NGXCG | 3,491.62 | 1.66 | 2.69 | 11.71 | 15.98 | 23.41 | 10,574 | |
| NGXCNSMRGDS | 2,648.75 | 2.25 | 4.31 | 11.38 | 45.89 | 52.72 | 3,205 | |
| NGXCOMMDTY | 1,047.21 | 0.30 | 0.58 | 5.15 | 4.35 | 4.72 | ||
| NGXGROWTH | 8,710.82 | 0.68 | 0.72 | 11.83 | 17.84 | 12.21 | 207 | |
| NGXINDUSTR | 3,713.34 | 2.24 | 5.43 | 7.80 | 6.40 | 3.97 | 2,134 | |
| NGXINS | 752.50 | 1.97 | 2.04 | 8.97 | 10.61 | -4.29 | 1,388 | |
| NGXLOTUSISLM | 9,392.59 | 0.94 | 4.15 | 12.87 | 24.34 | 34.80 | 3,568 | |
| NGXMAINBOARD | 5,955.76 | 1.29 | 2.32 | 7.27 | 17.67 | 19.02 | 15,985 | |
| NGXMERIGRW | 8,241.10 | 0.92 | 3.73 | 7.70 | 20.13 | 26.33 | 3,726 | |
| NGXMERIVAL | 11,357.14 | 3.41 | 6.50 | 10.62 | 10.34 | 8.88 | 5,808 | |
| NGXOILGAS | 2,500.47 | 1.10 | -0.43 | 7.19 | 2.20 | -7.77 | 454 | |
| NGXPENBRD | 2,203.91 | 0.93 | 1.84 | 8.83 | 16.69 | 20.33 | 17,425 | |
| NGXPENSION | 5,864.71 | 1.30 | 2.47 | 11.65 | 22.53 | 29.35 | 13,009 | |
| NGXPREMIUM | 11,688.82 | 1.09 | 2.14 | 12.48 | 14.99 | 20.10 | 5,107 | |
| NGXSOVBND | 652.03 | 0.00 | 0.00 | -0.64 | 4.02 | 8.39 | 0 |
For more detailed analysis,
- On InfoWARE Market Data Terminal <MKTINS> <GO>
- On InfoWARE Finance Mobile App ( Android, iPhone & iPad and Windows 10) , "Market Indexes"
Find the topic interesting? Will like to comment? Contact Us at solutions@infowarelimited.com
Top News

Chart Of The Day - ASI Chart Vs ASI Advance Decline Line (YTD) (25-Jun-2025 15:07:54.556)
InfoWARE AI Analyst Daily Market Report: 25-Jun-2025

[GUINEAINS]>> Earning Forcast - <Q3-2025> ?-<GUINEA INSURANCE PLC.>
[XNSA]>> CIS TRAINING ON "RETIREMENT PLANNING AND WEALTH CREATION & MANAGEMENT
[CADBURY]>>Corporate Disclosures-<CADBURY NIGERIA PLC.>
[AIRTELAFRI]>>Corporate Disclosures-<Airtel Africa Plc>
[XNSA]>> EMERGING AFRICA DAILY FUND PRICES
[XNSA]>> NGX FIXED INCOME INDICATIVE PRICE LIST FOR JUN 25, 2025
[VSPBONDETF]>> DAILY INDICATIVE PRICES
[XNSA]>> DAILY FUND PRICE SUBMISSION - FCMB ASSET MANAGEMENT LIMITED
[XNSA]>> SUPPLEMENTARY LISTING - STANBIC IBTC HOLDINGS PLC
[XNSA]>> TSL SPV PLC: LISTING OF BONDS
[STANBICETF30]>> DAILY INDICATIVE PRICES
[CORNERST]>>Notice of Meeting -<CORNERSTONE INSURANCE PLC>
[NEIMETH]>>Corporate Disclosures-<NEIMETH INTERNATIONAL PHARMACEUTICALS PLC>
Chart Of The Day - ASI Chart Vs ASI Advance Decline Line (YTD) (24-Jun-2025 15:07:06.121)
InfoWARE AI Analyst Daily Market Report: 24-Jun-2025
[DANGCEM]>>Corporate Disclosures-<DANGOTE CEMENT PLC>
[XNSA]>> CORDROS MILESTONE FUNDS' BID & OFFER PRICES
[XNSA]>> CIS TRAINING ON "RETIREMENT PLANNING AND WEALTH CREATION & MANAGEMENT
[BUACEMENT]>>Notice of Meeting -<BUA Cement Plc>
Please refer to Encoded Headline
[XNSA]>> DAILY FUND PRICE SUBMISSION - FCMB ASSET MANAGEMENT LIMITED
[AIRTELAFRI]>>Corporate Disclosures-<Airtel Africa Plc>
[NESTLE]>>Corporate Disclosures-<NESTLE NIGERIA PLC.>
[XNSA]>> OFF MARKET TRADE
[SIAMLETF40]>> DAILY INDICATIVE PRICES
Chart Of The Day - ASI Chart Vs ASI Advance Decline Line (YTD) (23-Jun-2025 15:10:18.461)
InfoWARE AI Analyst Daily Market Report: 23-Jun-2025
[NASCON]>>Notice of Meeting -<NASCON Allied Industries Plc>
Get IDIA - the stock trading app for the modern investor
Solutions by Business
Product Suites
Company
Contacts
- 8th Floor,
- South Atlantic Petroleum Towers,
- 1 Adeola Odeku Street,
- Victoria Island,
- Lagos, Nigeria.
- Email: solutions@infowarelimited.com
Follow Us
 |
 |
 |
 |