


InfoWARE Analyst Daily Market Report (10-Jan-2025 15:11:11.747) | InfoWARE Finance
Get IDIA - the stock trading app for the modern investor


InfoWARE Analyst Daily Market Report (10-Jan-2025 15:11:11.747)
(Source: InfoWARE Terminal, Date: 10-Jan-2025)
Dear Investor,
InfoWARE Analyst Daily Market Report - 10-Jan-2025 15:11:11.745
The Nigerian equities market recorded another down day, as the NGX All-Share Index (NGXASI) closed the day down by -0.08%,
to bring the Year-to-Date returns up 2.20%.
The All Share Index closed at 105,451.06 against the previous close of 105,530.74, volume traded increased by 5.17% from 484.47M to 509.54M, while market turnover (the total value of shares traded) decreased by -26.32% from NGN12.30B to NGN9.07B in 12,377.00 deals.
Market breadth (1.10x) signified Forty-three (43) advancers, as against Thirty-nine (39) decliners.
Volume was up for 85 companies and down for 76
|
Top ASI Gainers Over Last 5 Trading Days
|
Top ASI Losers Over Last 5 Trading Days
|
For more detailed analysis, on InfoWARE Market Data Terminal <NSEPERF> <GO>
On InfoWARE Finance Mobile App (Android, iPhone & iPad, Windows Phone and Windows 8/10), "Top Gainers & Losers"
C & I LEASING PLC. (CILEASING) topped the advancers list closing at N4.51 with a gain of 10.00% followed by HONEYWELL FLOUR MILL PLC (HONYFLOUR) which closed at N10.02 with a gain of 9.99%.
On the flip side SUNU ASSURANCES NIGERIA PLC. (SUNUASSUR) and EUNISELL INTERLINKED PLC (EUNISELL) topped the decliners log with a loss of -9.99% at a close of N7.30, and -9.96% to close the day at N17.35 respectively.
| Symbol | LClose | %Chg |
|---|---|---|
| CILEASING | 4.51 | 10.00 |
| HONYFLOUR | 10.02 | 9.99 |
| TRANSEXPR | 2.00 | 9.89 |
| RTBRISCOE | 2.57 | 9.83 |
| NSLTECH | 0.81 | 9.46 |
| Symbol | LClose | %Chg |
|---|---|---|
| SUNUASSUR | 7.30 | -9.99 |
| EUNISELL | 17.35 | -9.96 |
| SIAMLETF40 | 700.00 | -9.91 |
| SKYAVN | 30.15 | -9.87 |
| DAARCOMM | 0.88 | -9.28 |
For more detailed analysis,
- On InfoWARE Market Data Terminal <TOPG> <GO>
- On InfoWARE Finance Mobile App ( Android, iPhone & iPad and Windows 10) , "Top Gainers & Losers"
Currency Market
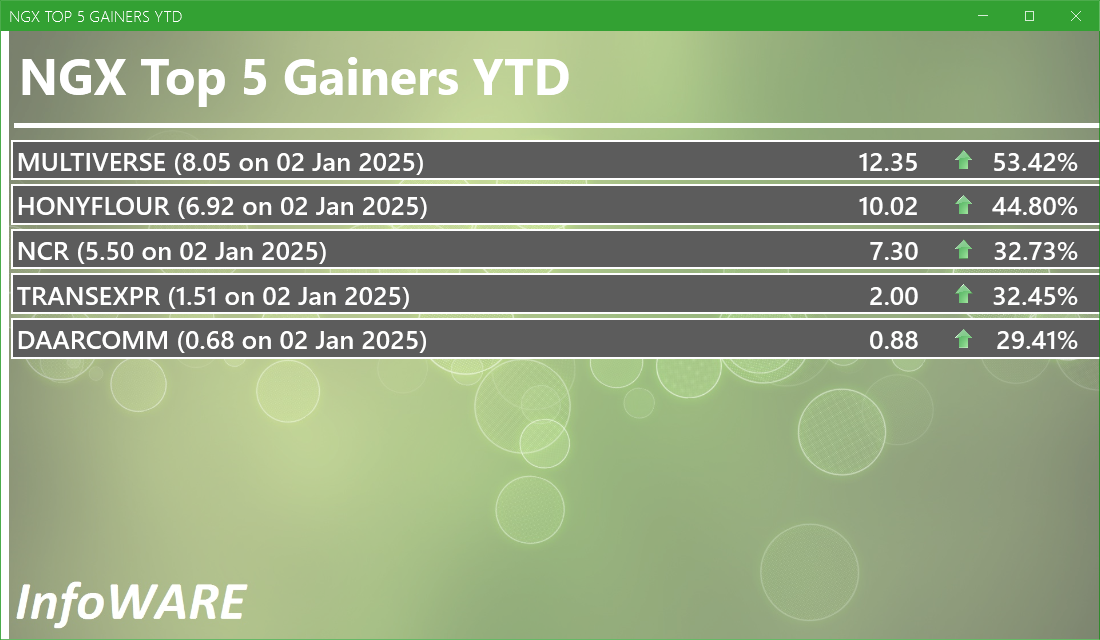
In the currency market, the Naira appreciated 0.05%(0.84) against the Dollar to settle at 1 to 1Investment Insights - Top 5 Gainers YTD
These stocks are the best performers whose price has risen faster than the market as a whole with the best returns year to date. Momentum investors believe that stocks that have outperformed the market will often continue to do so because the factors that caused them to outperform will not suddenly disappear. In addition, other investors seeking to benefit from the stock’s outperformance will often purchase the stock, further bidding its price higher and pushing the stock higher still
For more detailed analysis,
- On InfoWARE Market Data Terminal <T5YTD2> <GO>
- On InfoWARE Finance Mobile App ( Android , iPhone & iPad and Windows 10) , "Research"
NSE: Bull Signal - Price crossed above 15 Day MA
This signal implies these stocks are under buying pressure and the price might continue to rise and therefore positions should be monitored closely. Further suggested analysis include looking at the overall market (ASI) to see if the uptrend is market wide, sector wide or specific to the stock. Portfolio managers tend to use this as a signal to do more research to add to their positions or lock in some profits. Typically further analysis should be done using commands like PC and RV on the InfoWARE Market Data Terminal. Another command is ALERTS to set price triggers for possible exit or entry as necessary
For more detailed analysis,
- On InfoWARE Market Data Terminal <NSEPERF> <GO>
- On InfoWARE Finance Mobile App ( Android , iPhone & iPad and Windows 10) , "Top Gainers & Losers"
| Symbol | Price | %Chg | 15DMA | PE | EPS | DivY | MktCap | Vol | Trades | Value | LstTradeTime |
|---|---|---|---|---|---|---|---|---|---|---|---|
| FGS202770 | 120.00 | 75.00 | 69.33 | 0.00 | 0.00 | 20.00 | 2.00 | 24.00K | 10-Jan-2025 14:30:42.793 | ||
| JAPAULGOLD | 2.24 | 3.57 | 2.19 | 0.19 | 12.01 | 0.90 | 14.03B | 3.25M | 100.00 | 7.29M | 10-Jan-2025 14:30:30.700 |
| TIP | 2.55 | 1.18 | 2.54 | 0.00 | 2.27B | 141.03K | 8.00 | 359.90K | 10-Jan-2025 14:31:04.710 | ||
| GREENWETF | 534.00 | 0.75 | 533.73 | 0.00 | 0.00 | 10.00 | 1.00 | 5.34K | 10-Jan-2025 14:31:01.910 | ||
| MERGROWTH | 385.50 | 0.00 | 385.20 | 0.00 | 0.00 | 0.00 | 0.00 | 0.00 | 10-Jan-2025 14:31:01.940 | ||
| NGXINDUSTR | 3,573.90 | 0.00 | 3,573.59 | 39.90 | 18.97 | 0.00 | 0.00 | 6.15M | 499.00 | 236.87M | 10-Jan-2025 14:30:46.220 |
NSE: BEAR Signal - Price crossed below 15 Day MA
This signal implies these stocks are under selling pressure and the price might continue to slide and therefore positions should be monitored closely. Further suggested analysis include looking at the overall market (ASI) to see if the downtrend is market wide, sector wide or specific to the stock. If the overal market trend is upwards, then since these stocks are heading in the opposite direction, then further analysis should be done using commands like PC and RV on the InfoWARE Market Data Terminal. Another command is ALERTS to set price triggers for possible exit is necessar
For more detailed analysis,
- On InfoWARE Market Data Terminal <BEARM> <GO>
- On InfoWARE Finance Mobile App ( Android , iPhone & iPad and Windows 10)
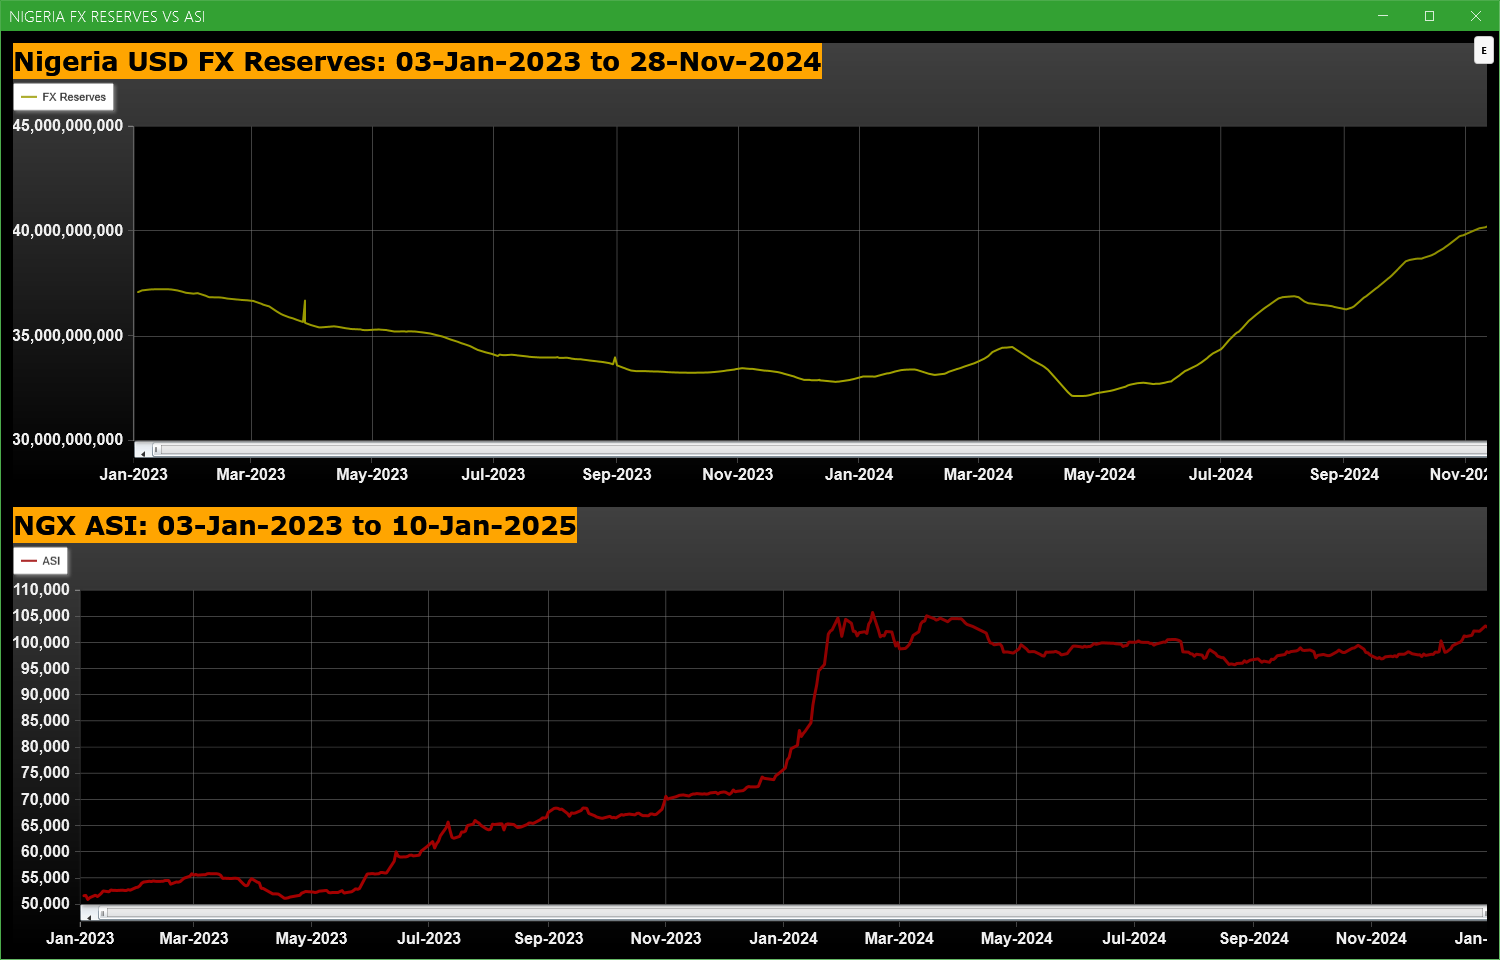
Economic Indicators - Nigeria FX Reserves Vs ASI Chart
Nigeria FX Reserves are assets held on reserve by CBN in foreign currencies. These reserves are used to back liabilities and influence monetary policy. Given the nature of the Nigeria economy, FX Reserves can appear to have an outsize influence on the economy and hence on the capital market. The chart below allows comparison of FX Reserves against the ASI to make investment decisions
For more detailed analysis,
- On InfoWARE Market Data Terminal <CI> <GO>
- On InfoWARE Finance Mobile App ( Android , iPhone & iPad and Windows 10) , "Research"
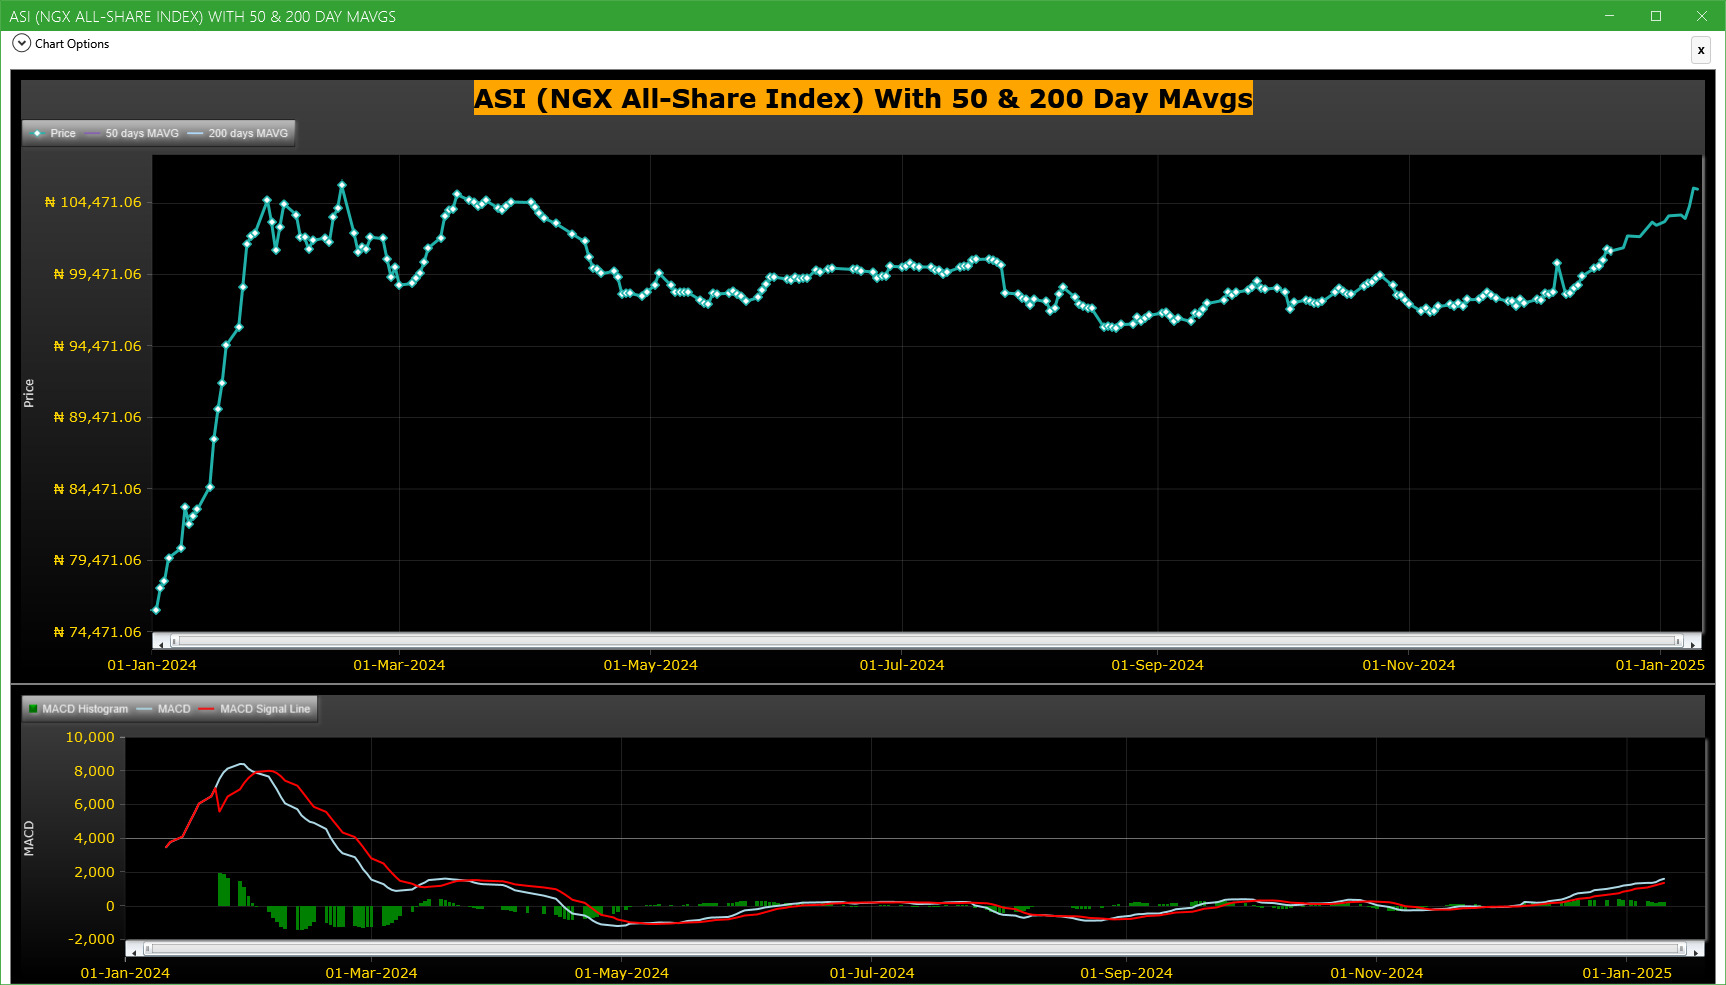
Market Trend - ASI (NGX All-Share-Index) With 50 & 200 Day MAvgs Chart
Technical traders typically use the 50 & 200 day moving averages to aid in choosing
where to enter or exit a position, which then causes these levels to act as strong
support or resistance. As a general guideline, if the price is above a moving average,
the trend is up. If the price is below a moving average, the trend is down.
It is important to note that critics of technical analysis say that moving averages act
as support and resistance because so many traders use these indicators to inform their
trading decisions. Also moving averages tend to work quite well in strong trending conditions
but poorly in choppy or ranging conditions.
Trading Strategies: Crossovers
Crossovers are one of the main moving average strategies. The first type is a price crossover,
which is when the price crosses above or below a moving average to signal a potential change
in trend. Another strategy is to apply two moving averages to a chart: one longer and one
shorter. When the shorter-term MA crosses above the longer-term MA, it is a buy signal, as
it indicates that the trend is shifting up. This is known as a golden cross. Meanwhile, when
the shorter-term MA crosses below the longer-term MA, it is a sell signal, as it indicates that
the trend is shifting down. This is known as a dead/death cross
For more detailed analysis,
- On InfoWARE Market Data Terminal <CI> <GO>
- On InfoWARE Finance Mobile App ( Android , iPhone & iPad and Windows 10) , "Research"
Unusual Volume: Volume traded is more than double the 90 day moving average (All exchanges; ASI & ASem). For more detailed analysis,
- On InfoWARE Market Data Terminal <UV> <GO>
- On InfoWARE Finance Mobile App ( Android , iPhone & iPad and Windows 10)
| Symbol | Name | Volume | 90DAvgVol | %VolChg | Price | LClose | %Chg | Trades | Value |
|---|---|---|---|---|---|---|---|---|---|
| TANTALIZER | TANTALIZERS PLC | 52.96M | 11.81M | 348.64 | 2.60 | 2.54 | 2.36 | 134 | 129.64M |
| UNIVINSURE | UNIVERSAL INSURANCE COMPANY PLC | 34.80M | 14.58M | 138.68 | 0.78 | 0.78 | 0.00 | 226 | 26.76M |
| NB | NIGERIAN BREW. PLC. | 27.29M | 2.90M | 842.35 | 32.00 | 32.20 | -0.62 | 106 | 873.28M |
| HONYFLOUR | HONEYWELL FLOUR MILL PLC | 24.85M | 3.29M | 656.36 | 10.02 | 9.11 | 9.99 | 523 | 240.43M |
| NAHCO | NIGERIAN AVIATION HANDLING COMPANY PLC | 21.12M | 1.53M | 1,281.72 | 48.50 | 48.50 | 0.00 | 225 | 961.87M |
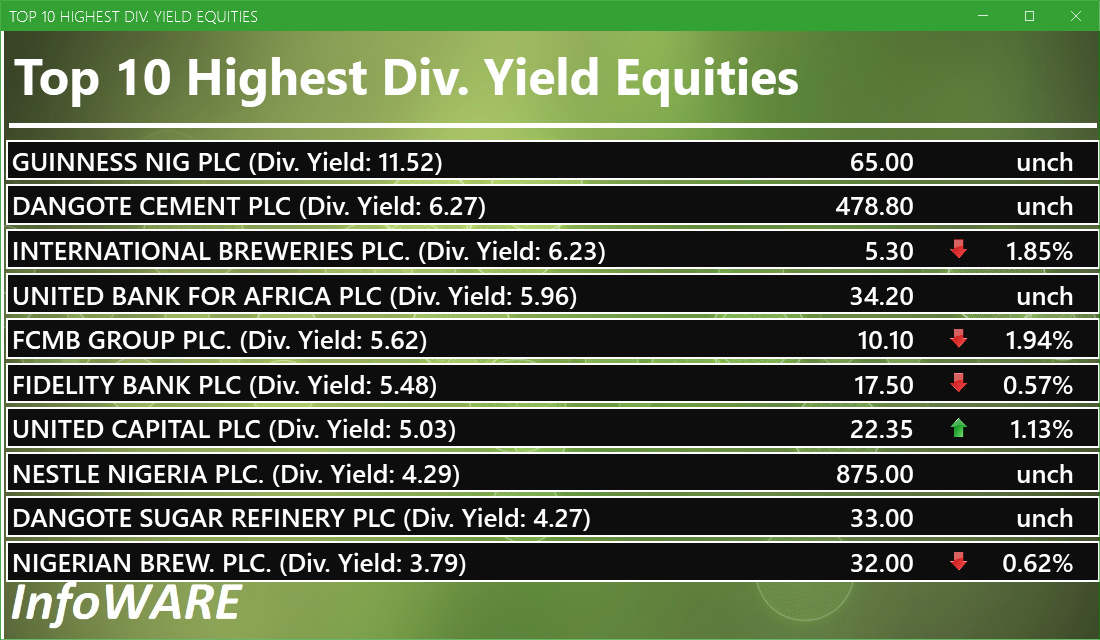
Investment Insights - High Div. Stocks
Dividend stocks distribute a portion of the company earnings to investors on a regular basis and they can a great choice for investors looking for regular income. As an investment or trading strategy, high dividend yield equities provide annual cash payments as against mostly capital gains in the price of a stock. The list in the table below represent the highest dividend paying stocks from the list of the most liquid stocks in the NSE top 30.
For more detailed analysis,
- On InfoWARE Market Data Terminal <HYIELD> <GO>
- On InfoWARE Finance Mobile App ( Android , iPhone & iPad and Windows 10) , "Research"
Investment Insights - Stocks outperforming the ASI but with approximately the same risk
These list of stocks represent equities that are less risky than the ASI but doing better than the ASI (All Shares Index) using the YTD (Year to Date) returns as the measure. The risk is measured by Beta. Beta is an assessment of a stock's tendency to undergo price changes, (its volatility), as well as its potential returns compared to the ASI. It is expressed as a ratio, where a score of 1 represents performance comparable to the ASI, and returns above or below the market may receive scores greater or lower than 1.
For a full list of both positively and negatively corelated stocks visit InfoWARE Market Data Terminal
- On InfoWARE Market Data Terminal <BANL> <GO>
- On InfoWARE Finance Mobile App ( Android , iPhone & iPad and Windows 10)
| Symbol | DivYield | PE | EPS | Beta | %ChgYTD | ASIYTDReturn | BetaDiff |
|---|---|---|---|---|---|---|---|
| HONYFLOUR | 1.40 | 16.28 | 0.31 | 0.99 | 44.80 | 2.20 | 0.01 |
| FIDELITYBK | 5.48 | 13.24 | 1.17 | 0.89 | 2.94 | 2.20 | 0.11 |
| DEAPCAP | 13.76 | 188.84 | 0.01 | 0.89 | 5.00 | 2.20 | 0.11 |
| VERITASKAP | 4.17 | 48.77 | 0.02 | 0.88 | 4.70 | 2.20 | 0.12 |
| UNIVINSURE | 0.00 | 0.00 | 0.00 | 0.83 | 8.33 | 2.20 | 0.17 |
| FTNCOCOA | 1.60 | 0.00 | 0.00 | 0.79 | 4.79 | 2.20 | 0.21 |
| WAPIC | 2.56 | 72.55 | 0.02 | 0.76 | 6.88 | 2.20 | 0.24 |
| LASACO | 4.05 | 21.56 | 0.11 | 0.71 | 6.19 | 2.20 | 0.29 |
| DAARCOMM | 0.00 | 0.00 | 0.00 | 0.71 | 29.41 | 2.20 | 0.29 |
| VETGRIF30 | 0.00 | 0.71 | 8.61 | 2.20 | 0.29 |
Chart of the day: OPEC Basket Price Vs ASI (365 Day Chart)
The OPEC basket is a weighted average of oil prices from the different OPEC members around the world. The basket is a benchmark, or reference point, for those monitoring the price of oil and the stability of the global oil market. Today, the OPEC basket averages the prices from Algeria, Angola, Ecuador, Gabon, Iran, Iraq, Kuwait, Libya, Nigeria, Qatar, Saudi Arabia, United Arab Emirates, and Venezuela. These fourteen countries represent the membership of OPEC. Many other countries throughout the world also produce oil. However, they are not OPEC members. Russia, the U.S., China, and Canada are all major oil producers but not OPEC members. OPEC?s member countries produce in total 40 percent of the world?s oil. (Definition Source: Investopedia.com)
For a full list of both positively and negatively corelated stocks visit InfoWARE Market Data Terminal
- On InfoWARE Market Data Terminal <BANL> <GO>
- On InfoWARE Finance Mobile App ( Android , iPhone & iPad and Windows 10)
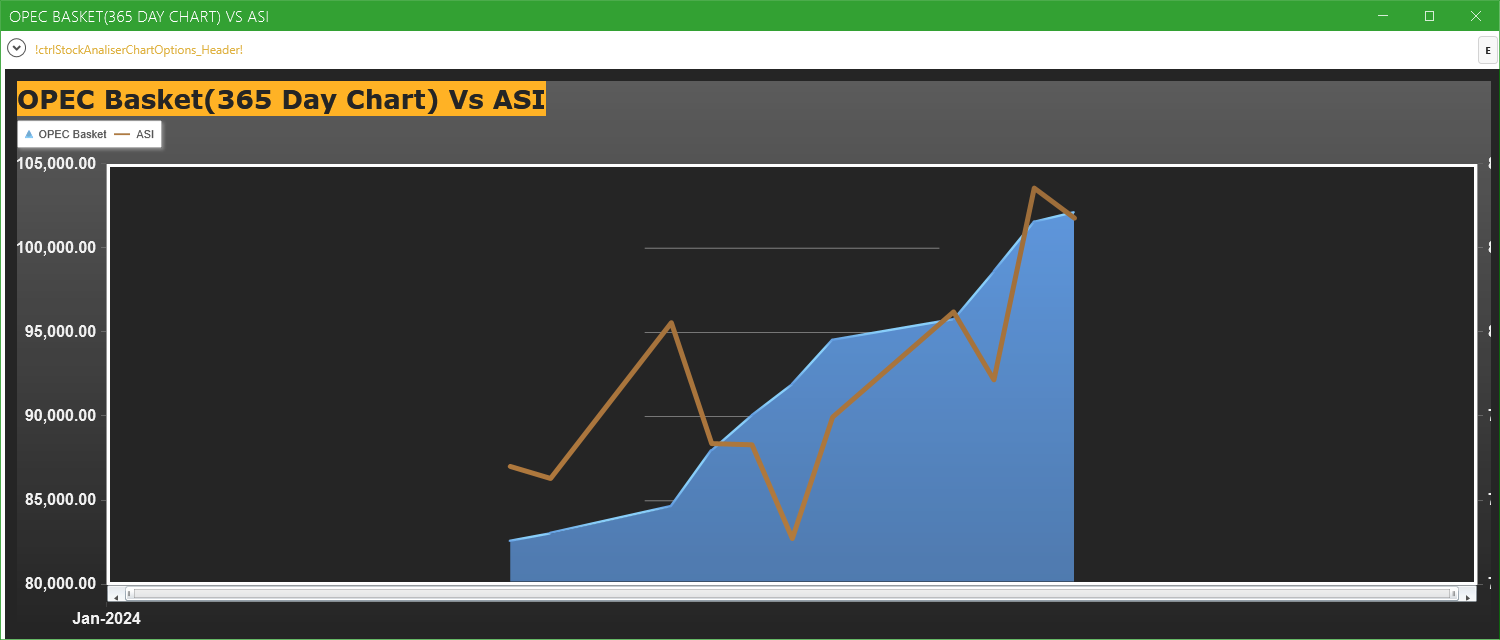
For more detailed analysis,
- On InfoWARE Market Data Terminal <OVA> <GO>
- On InfoWARE Finance Mobile App ( Android , iPhone & iPad and Windows 10) , "Research"
African Markets
| Name | LClose | Change | %Chg |
|---|---|---|---|
| BRVM Stock Exchange | 272.24 | -0.90 | -0.33 |
| Botswana Stock Exchange | 10,055.45 | 0.00 | 0.00 |
| Egyptian Exchange | 29,444.65 | -342.55 | -1.15 |
| Ghana Stock Exchange | 4,900.94 | 0.00 | 0.00 |
| Johannesburg Stock Exchange | 83,698.31 | 548.79 | 0.66 |
| Lusaka Stock Exchange | 15,423.78 | 1.54 | 0.01 |
| Casablanca Stock Exchange | 15,845.63 | 122.64 | 0.78 |
| Malawi Stock Exchange | 175,421.67 | 17.54 | 0.01 |
| Nigeria Stock Exchange | 105,530.74 | 1,302.85 | 1.25 |
| Nairobi Securities Exchange | 128.97 | 0.04 | 0.03 |
| Namibian Stock Exchange | 1,812.55 | 7.58 | 0.42 |
| Rwanda Stock Exchange | 149.04 | 0.19 | 0.13 |
| Tunis Stock Exchange | 9,880.66 | 27.59 | 0.28 |
| Uganda Securities Exchange | 1,250.39 | 13.36 | 1.08 |
Nigeria Market Indexes
| Symbol | LClose | %Chg | WTD% | MTD% | QTD% | YTD% | MktCap | Trades |
|---|---|---|---|---|---|---|---|---|
| ASI | 105,451.06 | -0.08 | 1.74 | 2.20 | 2.20 | 2.20 | 12,377 | |
| NGX30 | 3,908.21 | -0.07 | 2.19 | 2.45 | 2.45 | 2.45 | 5,718 | |
| NGXAFRBVI | 2,506.21 | 0.10 | -0.11 | 1.02 | 1.02 | 1.02 | 1,651 | |
| NGXAFRHDYI | 17,180.68 | 0.39 | -0.52 | 0.90 | 0.90 | 0.90 | 1,708 | |
| NGXASEM | 1,583.71 | 0.00 | 0.00 | 0.00 | 0.00 | 0.00 | 7 | |
| NGXBNK | 1,120.41 | -0.41 | 1.19 | 3.03 | 3.03 | 3.03 | 2,224 | |
| NGXCG | 2,923.70 | -0.25 | 2.08 | 3.34 | 3.34 | 3.34 | 6,200 | |
| NGXCNSMRGDS | 1,737.50 | -0.16 | 0.01 | 0.18 | 0.18 | 0.18 | 1,497 | |
| NGXGROWTH | 7,974.29 | 0.15 | 2.05 | 2.72 | 2.72 | 2.72 | 52 | |
| NGXINDUSTR | 3,573.90 | 0.00 | -0.17 | 0.06 | 0.06 | 0.06 | 499 | |
| NGXINS | 788.98 | -1.53 | -10.60 | 0.35 | 0.35 | 0.35 | 1,359 | |
| NGXLOTUSISLM | 7,194.69 | -0.01 | 3.02 | 3.26 | 3.26 | 3.26 | 1,761 | |
| NGXMAINBOARD | 5,052.89 | 0.01 | 0.59 | 0.98 | 0.98 | 0.98 | 9,403 | |
| NGXMERIGRW | 6,807.75 | 0.03 | 2.17 | 4.36 | 4.36 | 4.36 | 1,797 | |
| NGXMERIVAL | 10,487.41 | -0.36 | -0.77 | 0.55 | 0.55 | 0.55 | 2,570 | |
| NGXOILGAS | 2,688.75 | -0.08 | -0.27 | -0.83 | -0.83 | -0.83 | 315 | |
| NGXPENBRD | 1,877.19 | -0.05 | 1.98 | 2.49 | 2.49 | 2.49 | 9,623 | |
| NGXPENSION | 4,684.79 | -0.06 | 2.63 | 3.33 | 3.33 | 3.33 | 6,549 | |
| NGXPREMIUM | 10,178.88 | -0.24 | 3.97 | 4.58 | 4.58 | 4.58 | 2,922 | |
| NGXSOVBND | 606.61 | 0.00 | 0.00 | 0.84 | 0.84 | 0.84 | 0 |
For more detailed analysis,
- On InfoWARE Market Data Terminal <MKTINS> <GO>
- On InfoWARE Finance Mobile App ( Android, iPhone & iPad and Windows 10) , "Market Indexes"
Find the topic interesting? Will like to comment? Contact Us at solutions@infowarelimited.com
Top News

Chart Of The Day - ASI Chart Vs ASI Advance Decline Line (YTD) (10-Jan-2025 15:11:16.355)
InfoWARE Analyst Daily Market Report (10-Jan-2025 15:11:11.747)

[XNSA]>> OFF MARKET
Breaking News! Unusual Volume Alert (10-Jan-2025 12:21:16.105)
Breaking News! Bulls Momentum Alert (10-Jan-2025 12:21:08.135)
Breaking News! Bears Momentum Alert (10-Jan-2025 12:21:07.974)
[MERVALUE]>> DAILY INDICATIVE PRICES
[AIRTELAFRI]>>Corporate Disclosures-<Airtel Africa Plc>
[VSPBONDETF]>> DAILY INDICATIVE PRICES
[XNSA]>> NGX FIXED INCOME INDICATIVE PRICE LIST FOR JAN 10, 2025
[NOTORE]>>Notice of Meeting -<Notore Chemical Industries Plc>
[XNSA]>> CORDROS MILESTONE FUNDS' BID & OFFER PRICES
[XNSA]>> DAILY FUND PRICE SUBMISSION - FCMB ASSET MANAGEMENT LIMITED

Nigeria Daily Market Report | Local Bourse Extend Gains ASI up 1.2%

MARKET PERFORMANCE REPORT & DAILY PRICE LIST

: CardinalStone Research - Macro Flash Note: NBS GDP & CPI rebasing plans near completion
Chart Of The Day - ASI Chart Vs ASI Advance Decline Line (YTD) (09-Jan-2025 15:07:42.572)
InfoWARE Analyst Daily Market Report (09-Jan-2025 15:07:38.562)
[XNSA]>> DAILY FUND PRICE SUBMISSION - FCMB ASSET MANAGEMENT LIMITED
[XNSA]>> CORDROS MILESTONE FUNDS' BID & OFFER PRICES
[XNSA]>> RESIGNATION OF NON-EXECUTIVE DIRECTOR
MERGROWTH]>> DAILY INDICATIVE PRICES
[LOTUSHAL15]>> DAILY INDICATIVE PRICES
[VSPBONDETF]>> DAILY INDICATIVE PRICES
[XNSA]>> EMERGING AFRICA DAILY MUTUAL FUND PRICES
[XNSA]>> NGX FIXED INCOME INDICATIVE PRICE LIST FOR JAN 09, 2025,
[AIRTELAFRI]>>Corporate Disclosures-<Airtel Africa Plc>
[AIRTELAFRI]>>Corporate Disclosures-<Airtel Africa Plc>

Daily Market Report
MARKET PERFORMANCE REPORT & DAILY PRICE LIST
Get IDIA - the stock trading app for the modern investor
Solutions by Business
Product Suites
Company
Contacts
- 8th Floor,
- South Atlantic Petroleum Towers,
- 1 Adeola Odeku Street,
- Victoria Island,
- Lagos, Nigeria.
- Email: solutions@infowarelimited.com
Follow Us
 |
 |
 |
 |