


InfoWARE AI Analyst Daily Market Report: 05-Aug-2025 | InfoWARE Finance
Get IDIA - the stock trading app for the modern investor


InfoWARE AI Analyst Daily Market Report: 05-Aug-2025
(Source: InfoWARE Terminal, Date: 05-Aug-2025)
Dear Investor,
NGX Daily Market Summary & Insights – Tuesday, August 5, 2025
The NGX All Share Index (ASI) bounced back +0.50% to close at 144,071.78, extending its stellar year-to-date performance to 40.33%. Trading activity was robust, with volumes surging to 964.02M shares and total turnover up 14.45% to ₦20.77B. Market breadth remained strongly positive (2.38x), with 57 advancers outpacing 24 decliners. Noteworthy was a pronounced bullish bias in certain segments—insurance names especially stood out, both on price action and trading activity. Top gainer AIICO Insurance and several others posted double-digit gains with explosive volume spikes, signaling sustained investor appetite in selected sectors. Conversely, BUA Cement took a sharp 10% dive after a YTD rally, while bond ETFs saw wild swings with VETSPBOND ETF tumbling -13%. Read on for deep analytics on gainers/losers, momentum signals, and actionable ideas.
Market Breadth & Notable Trends
- Advancers vs. Decliners: 57 advancers vs 24 decliners; breadth ratio of 2.38x (bullish)—suggests broad market participation across sectors.
- Turnover Surge: Market value traded up 14.45% from prior day. This increase alongside higher volumes strengthens the case for a genuine demand-driven rally; institutions dominated value flow (85.82%).
-
Unusual Volume Patterns:
- Insurance stocks (AIICO, UNIVINSURE, LINKASSURE, VERITASKAP, WAPIC) all posted volume far above historical averages—LINKASSURE traded at 1839.6% its 90-day average!
- Insurance sector saw broad heavy buying and institutional interest—a clear trending sector.
Daily Leaders & Laggards
| Stock | % Change | Price | RSI | MACD | 15D/50D MA |
|---|---|---|---|---|---|
| AIICO INSURANCE | +10.00% | 2.64 | 68 | 0.13 | 2.25/1.85 |
| NIGERIAN ENAMELWARE | +10.00% | 29.70 | 93 (Overbought) | 1.94 | 24.77/21.40 |
| NEIMETH PHARMA | +10.00% | 7.70 | 51 | 0.22 | 7.36/5.80 |
| BUA CEMENT | +10.00% | 170.50 | 94 (Extremely Overbought) | 13.65 | 134.73/103.39 |
| MERGROWTH ETF | +10.00% | 805.20 | 84 | 70.33 | 550.88/447.61 |
| Stock | % Change | Price | RSI | MACD | 15D/50D MA |
|---|---|---|---|---|---|
| VETIVA S&P BOND ETF | -13.13% | 450.00 | 60 | 10.71 | 397.73/347.57 |
| LIVINGTRUST MORTGAGE BANK | -9.86% | 5.94 | 31 | 0.04 | 7.03/6.45 |
| ACADEMY PRESS | -9.60% | 8.95 | 64 | 1.31 | 9.08/6.47 |
| MECURE INDUSTRIES | -9.20% | 15.80 | 87 | 0.94 | 13.16/12.15 |
| VETIVA CONSUMER GOODS ETF | -8.45% | 32.50 | 77 | 2.35 | 31.58/26.73 |
| Stock | % Chg YTD | % Chg 5D | % Chg 1D | RSI | DivYield | Beta |
|---|---|---|---|---|---|---|
| MERGROWTH ETF | +104.11% | +33.09% | +10.00% | 83.95 (Overbought) | 0.00% | -2.31 |
| UACN PLC | +203.49% | +24.53% | +2.99% | 99.72 (Extreme OB) | 1.00% | 0.53 |
| MUTUAL BENEFITS (MBENEFIT) | +260.66% | +20.88% | +10.00% | 84.38 | 3.28% | 1.27 |
| BUA CEMENT PLC | +78.72% | +26.30% | +10.00% | 94.09 (OB) | 2.28% | 1.36 |
| AIICO INSURANCE PLC | +63.98% | +25.12% | +10.00% | 68.15 | 4.13% | 1.33 |
| Stock | % Chg YTD | % Chg 5D | % Chg 1D | RSI | DivYield | Beta |
|---|---|---|---|---|---|---|
| ACADEMY PRESS | -20.52% | -9.60% | -9.60% | 63.65 | 3.51% | 0.45 |
| LIVINGTRUST MB | -12.65% | -9.86% | -9.86% | 30.94 | 1.67% | 0.00 |
| TRANSPOWER PLC | -19.98% | -10.00% | 0.00% | 5.67 | 0.42% | 0.41 |
| UPL | -32.47% | -9.73% | 0.00% | 39.69 | 0.60% | 0.47 |
| DANGSUGAR | +90.77% | -15.65% | 0.00% | 59.55 | 4.27% | 1.35 |
Key Insights & Actionable Observations
- Turnover Surge: Today’s robust 14.45% increase in turnover and high volume reinforce technical breakouts in several trending stocks—opportunities appear genuine rather than speculative. If this trend holds, expect momentum continuation, especially in leading sectors.
- Advancers/Decliners: The outsized advancers-to-decliners ratio and positive market breadth suggest broad-based buying, often a precursor to index-level rallies. Be wary of possible short-term overextension in "overbought” names.
- Unusual Volumes: AIICO, LINKASSURE, VERITASKAP, WAPIC, and UNIVINSURE each traded 3x–18x their normal volume; all are insurance sector plays, flagging this space for continued institutional accumulation. Monitor for follow-through or sudden reversals.
-
Bullish Momentum Clustering: Stocks like NEIMETH, LASACO, INTENEGINS, LINKASSURE and GUINEAINS show 15DMA upward crossovers, healthy price action, and strong volumes. Many also exhibit RSI in the 65–80 zone, hinting at powerful but potentially overbought rallies.
- Insurance & Financials stand out in bullish momentum tables, echoing the volume trends above.
- Bearish Momentum Names: ACCESSCORP, INTBREW, CADBURY, and ACADEMY PRESS have crossed below their 15DMA—this is significant because all are large, liquid names; ACADEMY PRESS also ranks as a persistent YTD underperformer and may be close to an RSI support/bounce.
- ETF & Bond Volatility: VETIVA S&P Bond ETF and VETIVA Consumer Goods ETF posted top gainer/loser moves on wild volume and high volatility. Caution advised for traders—ETF flows suggest rotation or profit-taking is underway.
- Dividend & Beta Hotspots: AIICO (yield: 4.13%, Beta: 1.33) and MBENEFIT (3.28%, Beta: 1.27, YTD Gain: +260.66%) combine yield, aggressive price action and volume—attractive to both "growth & income” mandates.
Contrarian Signals
- BUA CEMENT (BUACEMENT): Despite a 10% price surge and extreme 94 RSI (heavily overbought), divergence risk is rising—sharp pullback possible.
- ACADEMY PRESS: RSI remains high at 64 even after several days of decline, and stock is in the YTD loser table; could signal short-covering or an oversold bounce.
- AIICO: Unusual volume with high RSI near 68—momentum could continue, but risk of profit-taking has increased short-term.
- VETIVA BOND ETF (VSPBONDETF): Parabolic 5-day move (+40%) followed by -13% drop and still mid-range RSI; signals potential whipsaw and volatility traps for late entrants.
- Insurance sector overall: While momentum and volumes are extremely bullish, excessive bullish clustering (high RSI, high vol, growth chasing) can presage sharp corrections on sector rotation.
Sector Performance Heatmap & Technical Trends
| Sector | Top Movers | Average % Change | Institutional Activity | Technical Signal |
|---|---|---|---|---|
| Insurance | AIICO, LINKASSURE, VERITASKAP, LASACO, SUNUASSUR | +7–10% | High (driven by institutionals & retail chase) | Bullish: RSI 68–80, above MAs, breakout vol |
| Banking | ETI, ACCESSCORP, ZENITHBANK, GTCO | -1–2% | Zenithbank: 20.2% institutional trade value share | Mixed: Value buyers absorbing supply, minor technical weakness in ACCESSCORP (below 15DMA) |
| Beverages/Food | CADBURY, INTBREW | -4–8% | Limited institutional | Bearish: Below 15DMA, falling RSI |
| Diversified/ETF | MERGROWTH, GREENWETF, VSPBONDETF | +20–40% recent, but volatile | Periodic institutional flows | Volatility driven: Swing trade only! |
Dividend/Beta Defensive Opportunities Matrix
| Stock | Dividend Yield | Beta | Momentum Signal | Note |
|---|---|---|---|---|
| AIICO INSURANCE | 4.13% | 1.33 | Bullish (15DMA Cross & High RSI) | Yield + Growth, but aggressive beta |
| AFRIPRUD | 1.27% | 0.64 | N/A | Classical defensive play |
| CORNERSTONE INSURANCE | 5.28% | 0.93 | Bullish (15DMA Cross) | Div + Growth + Low Beta |
| ETI | 2.00% | 0.39 | Bullish | Low risk for a bank stock |
| ZENITHBANK | 2.25% | 1.20 | Momentum Stalling | Yield, but under minor pressure |
- Note: High-dividend, lower-beta stocks like AFRIPRUD and CORNERSTONE are gaining traction as defensive plays, while aggressive plays (AIICO) attract both income and growth traders—but high beta signals added volatility ahead.
Institutional Clustering Alerts
- ZENITHBANK: Commanded 20.17% of institutional trade value. Indicates significant accumulation or rotation (possibly end of an overhang, or a set up for a move).
- GTCO, MTNN: Also heavily traded (3.8B and 695M value), suggesting strategic positioning in blue chips. Institutional flows dominate trade value across the board (86% overall).
Trader Playbook
- Trail Winners: Continue to ride trending stocks in insurance (AIICO, LINKASSURE, VERITASKAP, MBENEFIT), but trail stops tightly. Overbought readings (RSI > 70) on several names warn of snapbacks/profit-taking risk.
- Monitor Bearish Turnarounds: ACCESSCORP and ACADEMY PRESS appear at risk of extended declines given bearish momentum and breakdown below key MAs.
- Expect ETF Volatility: ETFs (MERGROWTH, VETSPBOND, VETGOODS) may offer swing-trading setups, but risk management is paramount given large range moves.
- Defensive Opportunities: Consider dividend yield plays with low beta (AFRIPRUD, ETI, CORNERSTONE) as a hedge if volatility spikes.
- Watch for Reflation in Banking: Sector lagged index today but heavy institutional trades in ZENITHBANK, GTCO, ACCESSCORP hint at base building or preemptive positioning.
Market Activity & Trades Split – Insights
- Institutional vs Retail: Institutional investors accounted for only 41% of trade count but 68% of volume and a striking 86% of trade value—pointing to high-conviction, large block trades, especially in blue chip and select financials.
-
Top Institutional Trades:
- GTCO (3.83B value),
- ZENITHBANK (1.12B),
- ACCESSCORP (865M),
- FCMB,
- MTNN (696M).
-
Top Retail Trades:
- MTNN
- UBA
- ACCESSCORP
- GTCO
- ZENITHBANK
- Correlations: All of the top institutional and retail symbols are in the Banking/Telecoms sector, overlapping with the most liquid names. AIICO (insurance) stands out in volume but is not (yet) a top institutional trade—suggesting a mix of hot money/speculative inflows alongside gradual accumulation.
- Actionable: If a stock is both a top gainer (or high volume), and features heavily in institutional trades, risk-reward for trend continuation is higher; if leadership names diverge from index, expect potential profit-taking.
Hidden Insights & Not-So-Obvious Patterns
- Sector Rotation: Insurance rally may be "late cycle”—contrarians should watch for reversal patterns if volumes dwindle or RSI crests above 80 on major names.
- Growth & Yield Overlap: Some growth breakout stocks are now also leading in dividend yields—suggests funds are hunting for total return, not just price, and could make trends "stickier.”
- ETF Whipsaws: High volatility in ETF products signals either portfolio hedging or sector-based allocations, short-term traders should be nimble.
Bottom Line: The market is in a "risk-on” phase, with insurance/fins/ETF names leading. Watch for sector rotation, trailing stops, and institutional flows for cues. High dividend and low beta stocks offer safety if volatility returns.
|
Top ASI Gainers Over Last 5 Trading Days
|
Top ASI Losers Over Last 5 Trading Days
|
For more detailed analysis, on InfoWARE Market Data Terminal <NSEPERF> <GO>
On InfoWARE Finance Mobile App (Android, iPhone & iPad, Windows Phone and Windows 8/10), "Top Gainers & Losers"
AIICO INSURANCE PLC. (AIICO) topped the advancers list closing at N2.64 with a gain of 10.00% followed by BUA CEMENT PLC (BUACEMENT) which closed at N170.50 with a gain of 10.00%.
On the flip side VETIVA S & P NIGERIA SOVEREIGN BOND ETF (VSPBONDETF) and LIVINGTRUST MORTGAGE BANK PLC (LIVINGTRUST) topped the decliners log with a loss of -13.13% at a close of N450.00, and -9.86% to close the day at N5.94 respectively.
| Symbol | LClose | %Chg |
|---|---|---|
| AIICO | 2.64 | 10.00 |
| BUACEMENT | 170.50 | 10.00 |
| ENAMELWA | 29.70 | 10.00 |
| MBENEFIT | 2.20 | 10.00 |
| NEIMETH | 7.70 | 10.00 |
| Symbol | LClose | %Chg |
|---|---|---|
| VSPBONDETF | 450.00 | -13.13 |
| LIVINGTRUST | 5.94 | -9.86 |
| UPDCREIT | 8.45 | -9.63 |
| ACADEMY | 8.95 | -9.60 |
| MECURE | 15.80 | -9.20 |
For more detailed analysis,
- On InfoWARE Market Data Terminal <TOPG> <GO>
- On InfoWARE Finance Mobile App ( Android, iPhone & iPad and Windows 10) , "Top Gainers & Losers"
Currency Market
In the currency market, the Naira was unchanged against the dollar at 1 to 1NSE: Bull Signal - Price crossed above 15 Day MA
This signal implies these stocks are under buying pressure and the price might continue to rise and therefore positions should be monitored closely. Further suggested analysis include looking at the overall market (ASI) to see if the uptrend is market wide, sector wide or specific to the stock. Portfolio managers tend to use this as a signal to do more research to add to their positions or lock in some profits. Typically further analysis should be done using commands like PC and RV on the InfoWARE Market Data Terminal. Another command is ALERTS to set price triggers for possible exit or entry as necessary
For more detailed analysis,
- On InfoWARE Market Data Terminal <NSEPERF> <GO>
- On InfoWARE Finance Mobile App ( Android , iPhone & iPad and Windows 10) , "Top Gainers & Losers"
| Symbol | Price | %Chg | 15DMA | PE | EPS | DivY | MktCap | Vol | Trades | Value | LstTradeTime |
|---|---|---|---|---|---|---|---|---|---|---|---|
| NEIMETH | 7.70 | 9.09 | 7.36 | 125.52 | 0.02 | 3.38 | 32.90B | 3.32M | 189.00 | 24.89M | 05-Aug-2025 14:30:18.830 |
| SUNUASSUR | 4.84 | 9.09 | 4.71 | 0.00 | 0.00 | 0.99 | 28.12B | 13.22M | 196.00 | 63.33M | 05-Aug-2025 14:30:19.353 |
| STANBICETF30 | 494.96 | 9.08 | 487.93 | 0.00 | 0.00 | 1.03K | 29.00 | 507.07K | 05-Aug-2025 14:30:58.340 | ||
| CORNERST | 4.82 | 8.92 | 4.54 | 8.62 | 0.35 | 5.28 | 87.56B | 7.97M | 104.00 | 38.17M | 05-Aug-2025 14:30:57.670 |
| LASACO | 3.14 | 8.92 | 2.99 | 21.56 | 0.11 | 4.05 | 5.76B | 23.13M | 284.00 | 70.92M | 05-Aug-2025 14:30:18.340 |
| INTENEGINS | 2.36 | 8.90 | 2.27 | 0.52 | 2.85 | 3.40 | 3.03B | 3.28M | 42.00 | 7.55M | 05-Aug-2025 14:30:18.263 |
| THOMASWY | 3.50 | 8.86 | 3.27 | 0.00 | 0.00 | 1.05 | 770.00M | 491.06K | 48.00 | 1.68M | 05-Aug-2025 14:30:19.380 |
| FGS202650 | 99.00 | 8.83 | 92.07 | 0.00 | 0.00 | 3.62K | 2.00 | 3.33M | 05-Aug-2025 14:30:24.623 | ||
| LINKASSURE | 1.59 | 8.81 | 1.48 | 59.89 | 0.02 | 5.56 | 22.26B | 64.03M | 123.00 | 101.34M | 05-Aug-2025 14:30:57.977 |
| GUINEAINS | 0.97 | 8.25 | 0.94 | 66.79 | 0.01 | 1.96 | 5.96B | 23.78M | 94.00 | 22.46M | 05-Aug-2025 14:30:18.023 |
| HONYFLOUR | 26.50 | 7.55 | 26.19 | 16.28 | 0.31 | 1.40 | 210.15B | 3.44M | 599.00 | 88.23M | 05-Aug-2025 14:30:18.113 |
| FGSUK2032S5 | 98.00 | 7.05 | 97.88 | 0.00 | 0.00 | 1.62K | 1.00 | 1.58M | 05-Aug-2025 14:31:03.560 | ||
| MAYBAKER | 17.75 | 4.79 | 17.25 | 58.94 | 0.14 | 3.75 | 30.62B | 1.27M | 148.00 | 21.84M | 05-Aug-2025 14:30:18.600 |
| ETI | 35.50 | 4.23 | 35.21 | 5.00 | 5.10 | 2.00 | 651.41B | 2.22M | 174.00 | 78.13M | 05-Aug-2025 14:30:17.403 |
| JAPAULGOLD | 2.84 | 3.17 | 2.81 | 0.19 | 12.01 | 0.90 | 17.79B | 27.72M | 304.00 | 78.71M | 05-Aug-2025 14:30:18.290 |
| CWG | 17.55 | 3.13 | 17.44 | 0.00 | 0.00 | 2.46 | 44.31B | 3.67M | 248.00 | 62.75M | 05-Aug-2025 14:30:17.110 |
| FGSUK2033S6 | 98.00 | 2.81 | 97.20 | 0.00 | 0.00 | 10.00K | 1.00 | 9.80M | 05-Aug-2025 14:31:03.570 | ||
| TRANSCORP | 50.70 | 1.38 | 50.45 | 0.00 | 0.00 | 0.23 | 2,060.85B | 5.49M | 434.00 | 278.44M | 05-Aug-2025 14:30:19.423 |
| ARADEL | 520.00 | 1.15 | 514.87 | 0.00 | 0.00 | 1.72 | 2,259.32B | 1.69M | 494.00 | 874.44M | 05-Aug-2025 14:30:16.447 |
NSE: BEAR Signal - Price crossed below 15 Day MA
This signal implies these stocks are under selling pressure and the price might continue to slide and therefore positions should be monitored closely. Further suggested analysis include looking at the overall market (ASI) to see if the downtrend is market wide, sector wide or specific to the stock. If the overal market trend is upwards, then since these stocks are heading in the opposite direction, then further analysis should be done using commands like PC and RV on the InfoWARE Market Data Terminal. Another command is ALERTS to set price triggers for possible exit is necessar
For more detailed analysis,
- On InfoWARE Market Data Terminal <BEARM> <GO>
- On InfoWARE Finance Mobile App ( Android , iPhone & iPad and Windows 10)
| Symbol | Price | %Chg | 15DMA | PE | EPS | DivY | MktCap | Vol | Trades | Value | LstTradeTime |
|---|---|---|---|---|---|---|---|---|---|---|---|
| ACCESSCORP | 27.35 | -1.65 | 27.53 | 8.56 | 2.81 | 1.87 | 972.16B | 36.72M | 1,715.00 | 1.01B | 05-Aug-2025 14:30:58.400 |
| INTBREW | 13.85 | -4.69 | 14.15 | 0.00 | 0.00 | 6.23 | 372.04B | 6.16M | 183.00 | 87.09M | 05-Aug-2025 14:30:57.830 |
| CADBURY | 63.00 | -7.94 | 66.47 | 33.25 | 0.64 | 1.88 | 118.33B | 4.53M | 444.00 | 285.85M | 05-Aug-2025 14:30:16.767 |
| ACADEMY | 8.95 | -10.61 | 9.08 | 0.00 | 0.00 | 3.51 | 6.77B | 1.52M | 152.00 | 13.77M | 05-Aug-2025 14:30:16.107 |
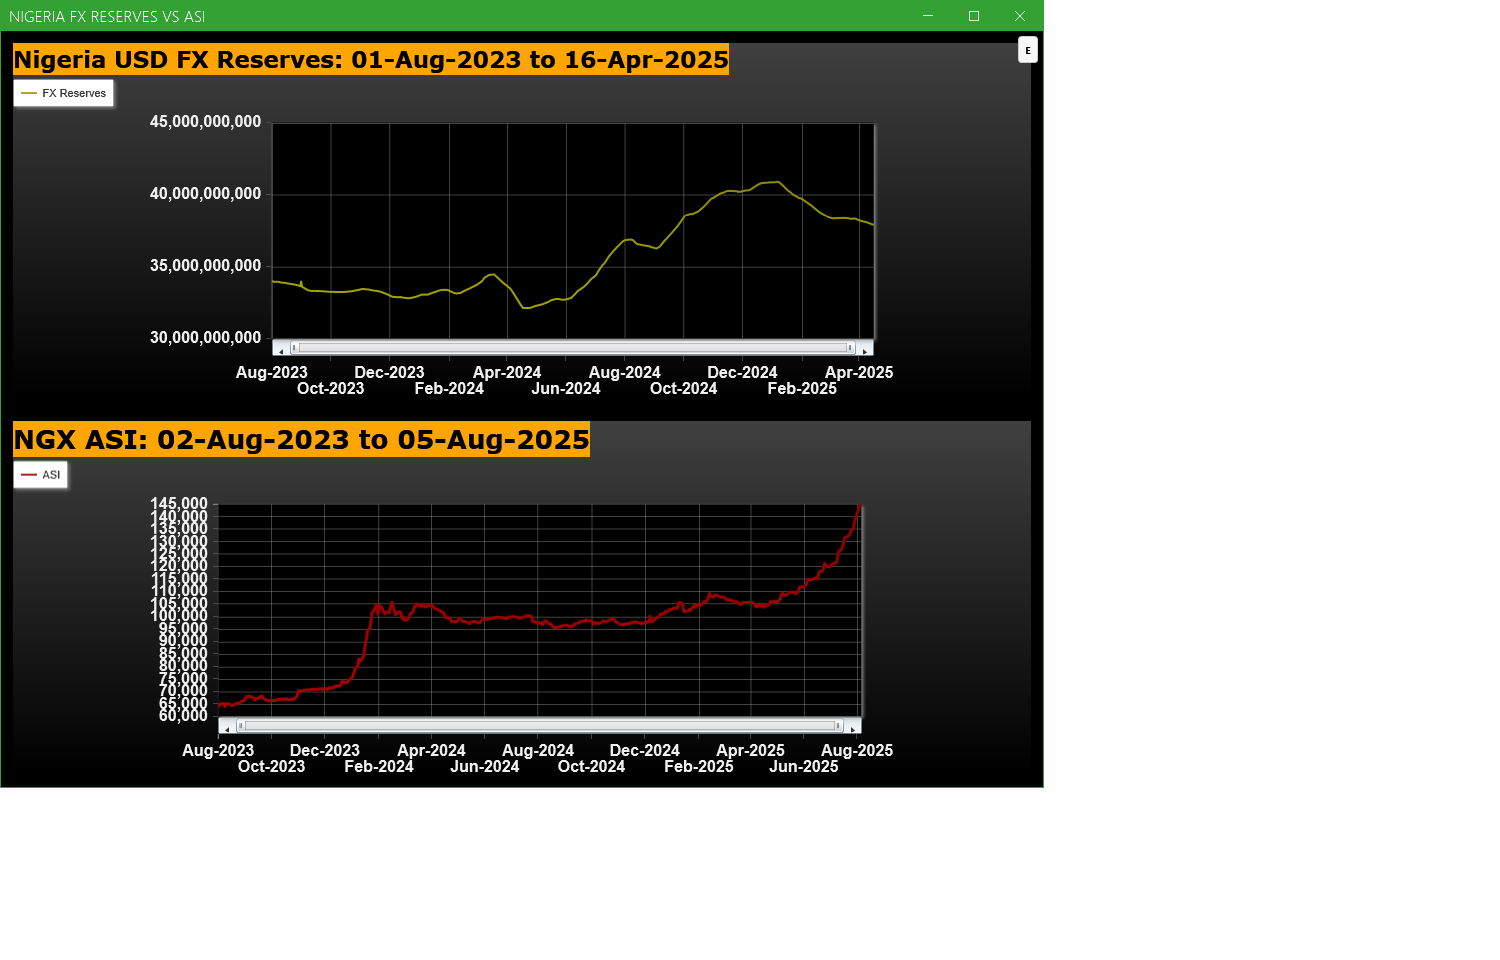
Economic Indicators - Nigeria FX Reserves Vs ASI Chart
Nigeria FX Reserves are assets held on reserve by CBN in foreign currencies. These reserves are used to back liabilities and influence monetary policy. Given the nature of the Nigeria economy, FX Reserves can appear to have an outsize influence on the economy and hence on the capital market. The chart below allows comparison of FX Reserves against the ASI to make investment decisions
For more detailed analysis,
- On InfoWARE Market Data Terminal <CI> <GO>
- On InfoWARE Finance Mobile App ( Android , iPhone & iPad and Windows 10) , "Research"
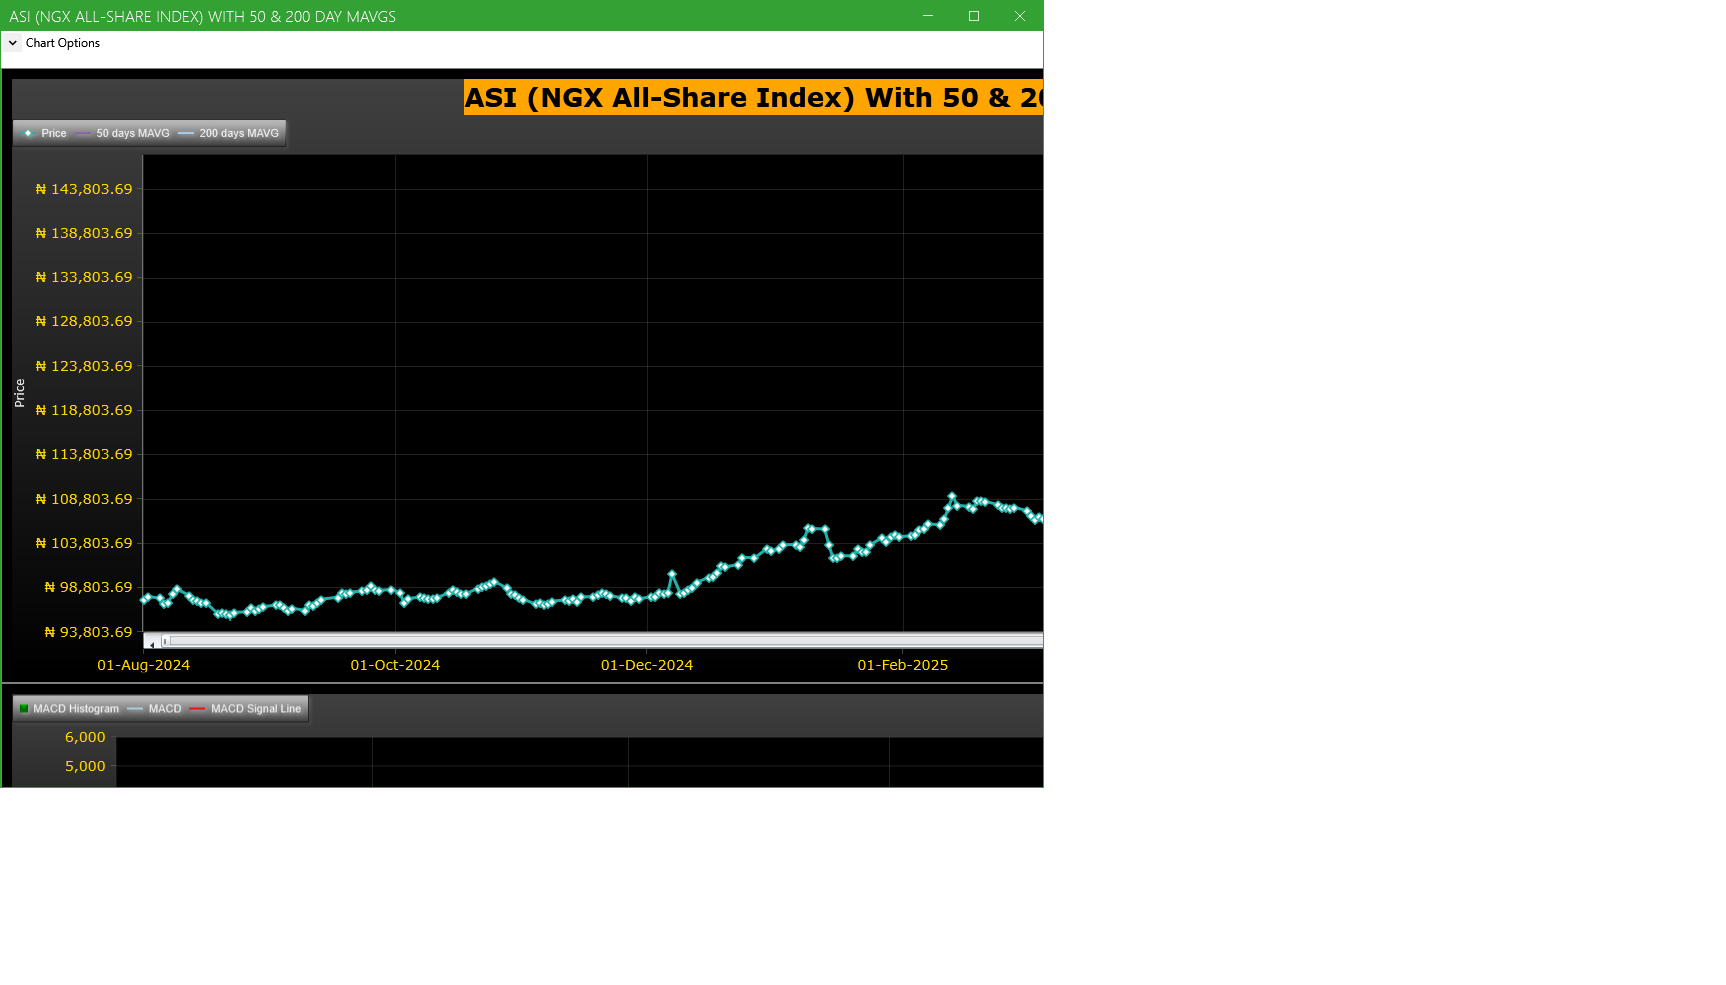
Market Trend - ASI (NGX All-Share-Index) With 50 & 200 Day MAvgs Chart
Technical traders typically use the 50 & 200 day moving averages to aid in choosing
where to enter or exit a position, which then causes these levels to act as strong
support or resistance. As a general guideline, if the price is above a moving average,
the trend is up. If the price is below a moving average, the trend is down.
It is important to note that critics of technical analysis say that moving averages act
as support and resistance because so many traders use these indicators to inform their
trading decisions. Also moving averages tend to work quite well in strong trending conditions
but poorly in choppy or ranging conditions.
Trading Strategies: Crossovers
Crossovers are one of the main moving average strategies. The first type is a price crossover,
which is when the price crosses above or below a moving average to signal a potential change
in trend. Another strategy is to apply two moving averages to a chart: one longer and one
shorter. When the shorter-term MA crosses above the longer-term MA, it is a buy signal, as
it indicates that the trend is shifting up. This is known as a golden cross. Meanwhile, when
the shorter-term MA crosses below the longer-term MA, it is a sell signal, as it indicates that
the trend is shifting down. This is known as a dead/death cross
For more detailed analysis,
- On InfoWARE Market Data Terminal <CI> <GO>
- On InfoWARE Finance Mobile App ( Android , iPhone & iPad and Windows 10) , "Research"
Unusual Volume: Volume traded is more than double the 90 day moving average (All exchanges; ASI & ASem). For more detailed analysis,
- On InfoWARE Market Data Terminal <UV> <GO>
- On InfoWARE Finance Mobile App ( Android , iPhone & iPad and Windows 10)
| Symbol | Name | Volume | 90DAvgVol | %VolChg | Price | LClose | %Chg | Trades | Value |
|---|---|---|---|---|---|---|---|---|---|
| AIICO | AIICO INSURANCE PLC. | 97.10M | 20.40M | 376.00 | 2.64 | 2.40 | 10.00 | 372 | 255.29M |
| UNIVINSURE | UNIVERSAL INSURANCE COMPANY PLC | 87.26M | 23.23M | 275.58 | 0.83 | 0.76 | 9.21 | 208 | 71.02M |
| LINKASSURE | LINKAGE ASSURANCE PLC | 64.03M | 3.30M | 1,839.64 | 1.59 | 1.45 | 9.66 | 123 | 101.34M |
| VERITASKAP | VERITAS KAPITAL ASSURANCE PLC | 50.18M | 12.02M | 317.53 | 1.67 | 1.52 | 9.87 | 471 | 83.17M |
| WAPIC | WAPIC INSURANCE PLC | 33.15M | 6.25M | 430.76 | 2.72 | 2.48 | 9.68 | 245 | 89.59M |
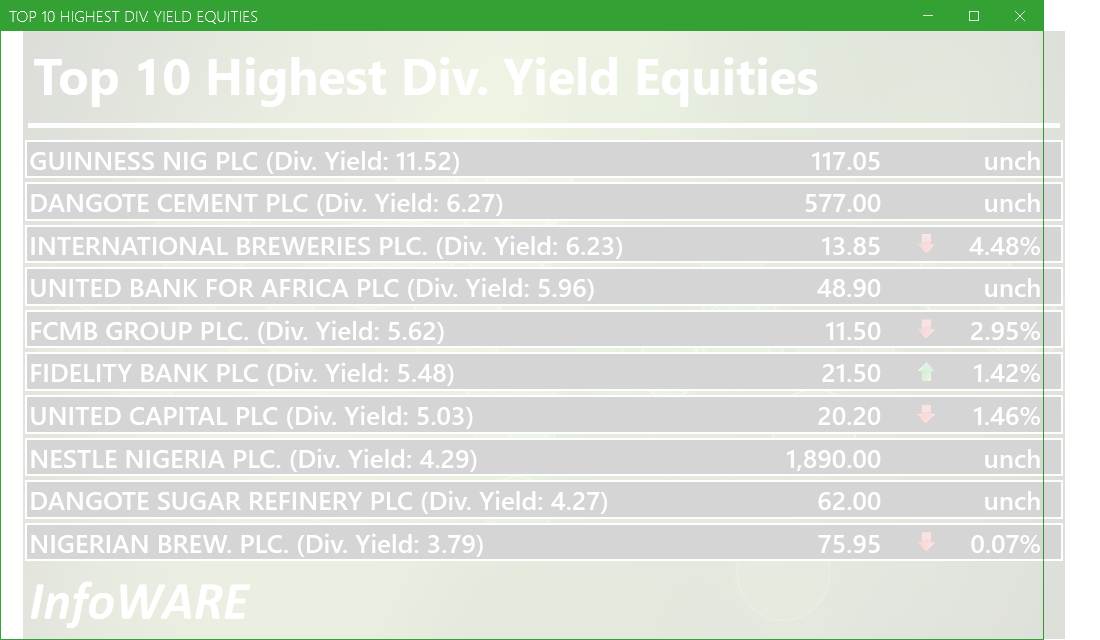
Investment Insights - High Div. Stocks
Dividend stocks distribute a portion of the company earnings to investors on a regular basis and they can a great choice for investors looking for regular income. As an investment or trading strategy, high dividend yield equities provide annual cash payments as against mostly capital gains in the price of a stock. The list in the table below represent the highest dividend paying stocks from the list of the most liquid stocks in the NSE top 30.
For more detailed analysis,
- On InfoWARE Market Data Terminal <HYIELD> <GO>
- On InfoWARE Finance Mobile App ( Android , iPhone & iPad and Windows 10) , "Research"
African Markets
| Name | LClose | Change | %Chg |
|---|---|---|---|
| BRVM Stock Exchange | 311.29 | -1.82 | -0.58 |
| Botswana Stock Exchange | 10,503.45 | 4.20 | 0.04 |
| Egyptian Exchange | 34,704.51 | 431.84 | 1.26 |
| Malawi Stock Exchange | 411,540.85 | 18,436.59 | 4.69 |
| Nigeria Stock Exchange | 144,071.78 | 2,811.09 | 1.99 |
| Nairobi Securities Exchange | 158.02 | -0.94 | -0.59 |
| Rwanda Stock Exchange | 150.43 | 0.00 | 0.00 |
| Uganda Securities Exchange | 1,353.64 | -11.33 | -0.83 |
Nigeria Market Indexes
| Symbol | LClose | %Chg | WTD% | MTD% | QTD% | YTD% | MktCap | Trades |
|---|---|---|---|---|---|---|---|---|
| ASI | 144,796.37 | 0.50 | 0.50 | 2.50 | 20.92 | 40.33 | 36,326 | |
| NGX30 | 5,308.28 | 0.37 | 0.37 | 2.37 | 12.38 | 39.15 | 19,775 | |
| NGXAFRBVI | 3,781.25 | -0.92 | -0.92 | -0.86 | 6.71 | 52.42 | 6,678 | |
| NGXAFRHDYI | 23,230.89 | -0.75 | -0.75 | 0.03 | 11.08 | 36.43 | 9,077 | |
| NGXASEM | 1,553.39 | 0.00 | 0.00 | 7.40 | -2.62 | -1.91 | 23 | |
| NGXBNK | 1,606.32 | -0.86 | -0.86 | -0.78 | 6.32 | 47.72 | 7,651 | |
| NGXCG | 4,289.96 | -0.61 | -0.61 | -0.27 | 24.76 | 51.63 | 18,479 | |
| NGXCNSMRGDS | 3,109.98 | -0.43 | -0.43 | 4.48 | -10.34 | 79.32 | 4,774 | |
| NGXCOMMDTY | 1,076.17 | 0.20 | 0.20 | -1.80 | 2.76 | 7.61 | ||
| NGXGROWTH | 10,767.39 | -7.61 | -7.61 | -2.71 | 13.23 | 38.70 | 422 | |
| NGXINDUSTR | 5,524.04 | 3.35 | 3.35 | 9.26 | 56.80 | 54.66 | 4,050 | |
| NGXINS | 986.33 | 7.51 | 7.51 | 11.20 | 33.54 | 25.46 | 2,723 | |
| NGXLOTUSISLM | 12,054.70 | 0.60 | 0.60 | 3.69 | 25.90 | 73.01 | 7,701 | |
| NGXMAINBOARD | 6,824.19 | 1.09 | 1.09 | 2.79 | 15.68 | 36.38 | 26,613 | |
| NGXMERIGRW | 10,484.98 | -0.76 | -0.76 | 1.70 | 8.63 | 60.73 | 4,542 | |
| NGXMERIVAL | 14,421.55 | -0.50 | -0.50 | -0.72 | 20.70 | 38.26 | 10,614 | |
| NGXOILGAS | 2,431.25 | 0.91 | 0.91 | -0.22 | 1.64 | -10.32 | 583 | |
| NGXPENBRD | 2,674.30 | 0.60 | 0.60 | 2.61 | 16.31 | 46.01 | 30,439 | |
| NGXPENSION | 6,932.90 | -0.24 | -0.24 | 0.27 | 9.10 | 52.91 | 22,945 | |
| NGXPREMIUM | 15,059.15 | -0.51 | -0.51 | 1.98 | 31.29 | 54.72 | 9,291 | |
| NGXSOVBND | 672.87 | 0.00 | 0.00 | 0.00 | 2.96 | 11.86 | 1 |
For more detailed analysis,
- On InfoWARE Market Data Terminal <MKTINS> <GO>
- On InfoWARE Finance Mobile App ( Android, iPhone & iPad and Windows 10) , "Market Indexes"
Find the topic interesting? Will like to comment? Contact Us at solutions@infowarelimited.com
Top News

Chart Of The Day - ASI Chart Vs ASI Advance Decline Line (YTD) (05-Aug-2025 15:07:24.801)
InfoWARE AI Analyst Daily Market Report: 05-Aug-2025

[XNSA]>> CORDROS MILESTONE FUNDS' BID & OFFER PRICES
[ETI]>>Corporate Disclosures-<ECOBANK TRANSNATIONAL INCORPORATED>
[XNSA]>> NGX NON-INTEREST FINANCE BOARD LAUNCH COMMUNIQUE
[MERGROWTH]>> DAILY INDICATIVE PRICES
[XNSA]>> CIS ACADEMY TRAINING
[VSPBONDETF]>> DAILY INDICATIVE PRICES
[XNSA]>> NGX FIXED INCOME INDICATIVE PRICE LIST FOR AUG 05, 2025
[XNSA]>> FGN SAVINGS BOND OFFER AUGUST 2025
[XNSA]>> RESIGNATION OF A DIRECTOR (STANBIC IBTC STOCKBROKERS LIMITED)
[UCAP]>>Corporate Disclosures-<UNITED CAPITAL PLC>
[CILEASING]>>Notice of Meeting -<C AND I LEASING PLC.>
Chart Of The Day - ASI Chart Vs ASI Advance Decline Line (YTD) (04-Aug-2025 15:11:04.157)
InfoWARE AI Analyst Daily Market Report: 04-Aug-2025
[ABBEYBDS]>>Corporate Disclosures-<ABBEY MORTGAGE BANK PLC>
[XNSA]>> EAAML MUTUAL FUNDS YIELDS AND PRICES
[XNSA]>> CIS ACADEMY TRAINING
[XNSA]>> CORDROS MILESTONE FUNDS' BID & OFFER PRICES
[XNSA]>> NGX FIXED INCOME INDICATIVE PRICE LIST FOR AUG 04, 2025
[VSPBONDETF]>> DAILY INDICATIVE PRICES
[CILEASING]>>Notice of Meeting -<C AND I LEASING PLC.>
[MCNICHOLS]>>Notice of Meeting -<MCNICHOLS CONSOLIDATED PLC>
[MERVALUE]>> DAILY INDICATIVE PRICES
[STANBICETF30]>> DAILY INDICATIVE PRICES
InfoWARE AI Analyst Weekly Market Report: 01-Aug-2025
Chart Of The Day - ASI Chart Vs ASI Advance Decline Line (YTD) (01-Aug-2025 15:07:02.003)
InfoWARE AI Analyst Daily Market Report: 01-Aug-2025
[AIRTELAFRI]>>Corporate Disclosures-<Airtel Africa Plc>
[XNSA]>> CORDROS MILESTONE FUNDS' BID & OFFER PRICES
Get IDIA - the stock trading app for the modern investor
Solutions by Business
Product Suites
Company
Contacts
- 8th Floor,
- South Atlantic Petroleum Towers,
- 1 Adeola Odeku Street,
- Victoria Island,
- Lagos, Nigeria.
- Email: solutions@infowarelimited.com
Follow Us
 |
 |
 |
 |