


InfoWARE AI Analyst Daily Market Report: 08-Dec-2025 | InfoWARE Finance
Get IDIA - the stock trading app for the modern investor


InfoWARE AI Analyst Daily Market Report: 08-Dec-2025
(Source: InfoWARE Terminal, Date: 08-Dec-2025)
Dear Investor,
NGX Daily Market Summary – Monday, 8 December 2025
Market Recap & Highlights
The Nigerian equities market opened the week in a positive mood, with the NGX ASI ticking up 0.26% to close at 147,040.08, maintaining its impressive 42.88% YTD return. Despite a decrease in market turnover by 2.52% to N12.97B, trade deals surged to 28,567, and volume traded climbed sharply to 535 million, up from 346 million in the previous session—a strong signal of growing market activity. Market breadth remained robust, with 51 advancers versus just 18 decliners (breadth ratio 2.83x), underlining healthy bullish sentiment. Today's leaders were the ETFs, with NEWGOLD ETF jumping 11.32% and Meristem ETFs also featuring prominently. Momentum stocks, unusual volume spikes, and strong technicals continue to guide trader focus—and with last week also closing higher, institutional activity and technical crossovers are setting the tone.
The Previous Week at a Glance
Last week, the NGX ASI maintained upward momentum, closing above 147k with broad-based rallies across notable sectors. Sector rotation remained evident, with funds flowing into both traditional financials and defensives, and ETF activity picking up. Retail participation was strong, but institutions dominated by value traded, suggesting accumulation in top banking names and select momentum plays.
Key Trends & Unusual Patterns
- Market Breadth: 51 stocks advanced vs 18 decliners (2.83x breadth) — a bullish sign reflecting strong underlying support, especially compared with persistent upward volumes (+90 companies up in volume vs 52 down).
- Liquidity Shifts: Trade volume soared 54.3% day-on-day, but value declined slightly. This hints at increased trading in lower-priced or highly liquid stocks—and ETF volumes and value, especially for NEWGOLD, contributed to this dynamic.
- ETF Leadership: Both the top gainer (NEWGOLD: +11.32%) and top losers (MERVALUE: -10.00%; VETGRIF30: -9.07%) were ETFs, underscoring the increasing influence of passive vehicles. SIAMLETF40 also stood out among gainers.
- Unusual Volume: UPDC: 689% above average; FCMB: 324% above average. JAPAULGOLD traded 253% above its 90-day average, accompanied by a strong price gain (+3.81%)—fresh bullish momentum signal.
- Technical Momentum: Several stocks triggered bullish crossovers with RSI > 70 (notably in top ETFs and MORISON), while some large-caps (e.g., FIDELITYBK, ACCESSCORP) show bearish signals with price below 15DMA along with mixed-to-weak RSI/MACD.
Top 5 Gainers & Losers (YTD and 5-Day Rolling)
| Name | Symbol | Price | %ChgYTD | RSI | DivYield | PE |
|---|---|---|---|---|---|---|
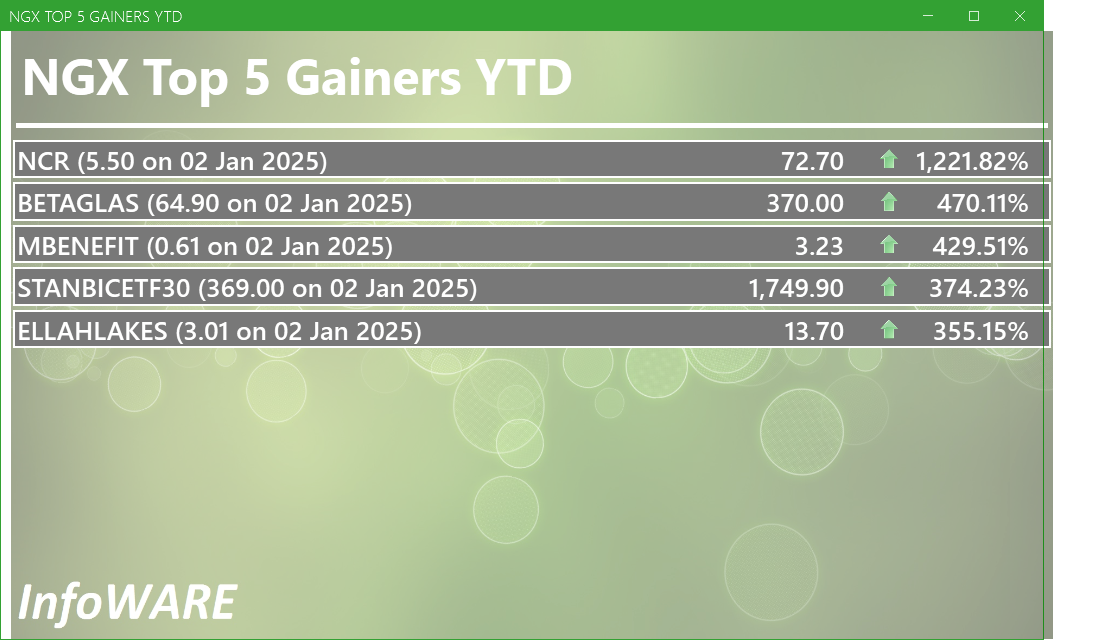
| STANBIC IBTC ETF 30 | STANBICETF30 | 1,645.54 | +374.23% | 92.03 | 0.00 | null |
| ELLAH LAKES PLC. | ELLAHLAKES | 13.70 | +355.15% | 56.01 | 0.00 | null |
| U A C N PLC. | UACN | 96.80 | +193.78% | 85.47 | 1.00 | 9.38 |
| ASSOCIATED BUS CO. | ABCTRANS | 3.10 | +152.03% | 7.63 | 2.19 | 6.68 |
| NIGERIAN BREW PLC. | NB | 75.00 | +134.38% | 64.30 | 3.79 | 16.95 |
| Name | Symbol | Price | %ChgYTD | RSI | DivYield | PE |
|---|---|---|---|---|---|---|
| UNION DICON SALT PLC. | UNIONDICON | 6.30 | -16.67% | 35.02 | 6.25 | 0.00 |
| OMATEK VENTURES | OMATEK | 1.19 | +43.75% | 47.70 | 0.00 | 6.82 |
| VETIVA CONSUMER GOODS ETF | VETGOODS | 36.45 | +97.67% | 48.97 | 0.00 | null |
| VETIVA GRIFFIN 30 ETF | VETGRIF30 | 66.15 | +59.34% | 59.06 | 0.00 | null |
| GUINEA INSURANCE PLC. | GUINEAINS | 1.15 | +34.83% | 46.53 | 1.96 | 66.79 |
Further Detailed Insights/Predictions
- Turnover Drop: The 2.52% drop in market value despite surging volume signals a shift to more speculative stocks or ETFs, less dominated by high-value blue-chips.
- Advancers Outpacing Decliners: The 2.83x advancers/decliners ratio, coupled with >50 rising stocks, points to strong near-term confidence, possibly spurred by positive macro/currency sentiment and seasonality.
- Unusual Volume Stocks:
- UPDC (+689.82% from average): Potential catalysts, possibly corporate action/news—highly speculative, traders watch for price follow-through.
- FCMB (+324.17%): Unusually strong institutional participation, with price modestly up—possible accumulation.
- JAPAULGOLD and UPDCREIT also delivered volume spikes with positive price action—watch for momentum continuation.
- Technical Bullish (RSI & Moving Averages): Bullish crossovers abound: MORISON (RSI 92.6!) and SIAMLETF40 (RSI 91.7) may approach overbought—momentum traders will ride but look for pending reversals. NEWGOLD crosses above its 15DMA and also features in gainers and unusual ETF flows.
- Technical Bearish: FIDELITYBK, ACCESSCORP, OMATEK show price crossing below 15DMA—bearish signals. Volume tapering or price weakness in these could foreshadow near-term pullbacks.
- YTD Gainers in Momentum Tables: SIAMLETF40, CHAMS, MORISON and NEWGOLD appear across YTD gainers, today's gainers, and bullish momentum tables, establishing strong technical and fundamental credibility.
- Bullish 15DMA Cross: AFRIPRUD – defensive play (low Beta 0.64, yield 1.27%)—combine for a steady income/momentum hybrid.
Contrarian Signals
- CHAMPION (from previous day context): RSI is mid-range (54.4) with bullish MACD, but negative YTD performance (-9.8%)—suggests any strength may not be sustainable unless accompanied by volume & sector confirmation.
- MORISON: RSI at 92.6 (overbought) yet still on a multi-day tear. This could be a textbook "too-far-too-fast"—profit-taking risk is rising.
- GUINEAINS: YTD positive, just crossed 15DMA, yet still among YTD laggards—late-cycle bounce or a signal of underlying value hidden by poor longer-term performance?
Sector Heatmap & Institutional/Retail Activity
| Sector | Avg. % Change | Bullish Stocks | Bearish Stocks |
|---|---|---|---|
| ETFs | +6.2% | NEWGOLD, SIAMLETF40 | MERVALUE, VETGRIF30 |
| Insurance | +2.9% | WAPIC, MANSARD, GUINEAINS, SOVRENINS | LASACO |
| Micro Finance | +8.9% | NPFMCRFBK, LIVINGTRUST | JAIZBANK |
| Banking | +2.2% | FCMB, ZENITHBANK | FIDELITYBK, ACCESSCORP |
| Media/Entertainment | -7.1% | DAARCOMM | |
| Food Products | -0.8% | LIVINGTRUST |
Institutional/retail activity (see below) also suggests clustering in major banking stocks and ETFs.
Dividend–Beta Matrix: Defensive Opportunities
| Stock | Dividend Yield | Beta | Comment |
|---|---|---|---|
| AFRIPRUD | 1.27% | 0.64 | Income plus solid momentum, supports defensive case with upside |
| MANSARD | 4.59% | 0.62 | High yield, low beta; stable despite market volatility |
| GUINEAINS | 1.96% | 1.51 | Yield, but higher volatility; monitor if risk appetite is low |
| UCAP | 5.03% | 0.74 | Attractive yield for conservative portfolios |
Institutional Clustering Alerts
- ZENITHBANK led institutional trade, claiming 20.17% of institutional trade value (N2.6B out of ~N13B total market turnover). Other bank heavyweights saw significant but smaller shares.
- FCMB isn't just an unusual volume story—its institutional flows underline strong buy-side conviction and possible accumulation trend.
High Dividend Yield in Momentum/Bearish Tables – Implications
- AFRIPRUD and MANSARD: Both show up in bullish momentum tables with attractive dividend yields and low beta, enhancing their appeal as defensive growth plays.
- GUINEAINS has yield and bullish momentum but remains a laggard YTD. It could be a "late riser"—watch if defensive names gain new leadership.
Trading Desk Suggestions & Opportunities
- Momentum Focus: Stay with leaders in bullish crossover: NEWGOLD, SIAMLETF40, MORISON (with caution on overbought), CHAMS (if sustained volume appears).
- Defensive Rotation: Investors looking for lower-risk, yield-based returns may rotate to AFRIPRUD, UCAP, MANSARD.
- ETF Flows: Given heavy ETF volatility, traders can deploy range strategies or momentum tracking in NEWGOLD and MERVALUE; expect swift moves, tight stops are advised.
- Turnover Watch: If turnover remains below the prior average even as volumes rise, caution is warranted—could suggest froth in speculative small caps, potential for whipsaws.
- Banking Review: FCMB, ZENITHBANK, UBA, GTCO dominated institutional and retail trading; attractive for liquidity-based strategies and short-term trades.
- Profit Taking Alert: MORISON (RSI 92.6) and STANBICETF30 (RSI 92.0) are overbought—consider scaling out or using trailing stops.
Market Activity/Trade Summaries — Insights
| Rank | Type | Symbol | Trade Count | Volume | Value (N) |
|---|---|---|---|---|---|
| 1 | Institutional | ZENITHBANK | 237 | 40.4M | 2.61B |
| 2 | Institutional | UBA | 117 | 11.6M | 467M |
| 3 | Institutional | FCMB | 114 | 125.8M | 1.39B |
| 4 | Institutional | ACCESSCORP | 113 | 24.2M | 518M |
| 5 | Institutional | FIDELITYBK | 112 | 34.7M | 659M |
| 1 | Retail | MTNN | 1,704 | 187.7K | 88.7M |
| 2 | Retail | ACCESSCORP | 1,364 | 4.3M | 93.5M |
| 3 | Retail | ZENITHBANK | 1,241 | 1.6M | 102.3M |
| 4 | Retail | GTCO | 1,166 | 833.6K | 74.9M |
| 5 | Retail | UBA | 1,040 | 1.99M | 80.0M |
- Institutional Focus: Clustered on the banking sector (ZENITHBANK, UBA, ACCESSCORP, FCMB) — signals ongoing accumulation, especially with ZENITHBANK holding an outsized share of total institutional value.
- Retail Activity: While MTNN is a retail favorite for trade count, the volume and value pale next to institutional names—shows the "hot money” difference and a lag in influence on price action.
- Correlation: Stocks in institutional lists (especially with unusual volume—like FCMB) may be at an inflection for continuation or mean-reversion, depending on whether retail follows through.
- Use in Trading Decisions: Institutions often lead accumulation in uptrends, especially banking stocks; high retail participation can mean short-term pops or volatility, but durability often follows institutional flows.
Macro/Currency Note
The Naira continued its modest rally, appreciating 0.06% to 1,447/$ — a mild but positive backdrop for equities, especially those with USD-cost exposures (e.g., importers, multinational ETFs).
Bottom Line—Final Takeaways
- Bullish bias persists: Strong breadth, strong ETF leadership, positive currency moves.
- Profit-taking likely in overbought leaders (e.g., MORISON, SIAMLETF40).
- Banks remain institutional favorites—follow the smart money.
- Defensive high-yield/low-beta stocks like AFRIPRUD align with both income and momentum strategies—consider as portfolio anchors.
- Watch for high-volume anomalies in speculative sectors or ETF rebalancing.
- Retail trading surges, but value/trend in banks/large ETFs—best opportunities may still be found following institutional clustering patterns and cross-verifying with technical signals.
For tomorrow, monitor for profit-taking in overheated momentum names and sustain focus on institutional clustering patterns and defensive blends. Tighten risk controls if playing the increasingly volatile mid- and small-cap names.
|
Top ASI Gainers Over Last 5 Trading Days
|
Top ASI Losers Over Last 5 Trading Days
|
For more detailed analysis, on InfoWARE Market Data Terminal <NSEPERF> <GO>
On InfoWARE Finance Mobile App (Android, iPhone & iPad, Windows Phone and Windows 8/10), "Top Gainers & Losers"
NEWGOLD EXCHANGE TRADED FUND (ETF) (NEWGOLD) topped the advancers list closing at N59,002.00 with a gain of 11.32% followed by MERISTEM VALUE EXCHANGE TRADED FUND (MERVALUE) which closed at N378.40 with a gain of 10.00%.
On the flip side VETIVA GRIFFIN 30 ETF (VETGRIF30) and DAAR COMMUNICATIONS PLC (DAARCOMM) topped the decliners log with a loss of -9.07% at a close of N60.15, and -7.14% to close the day at N0.91 respectively.
| Symbol | LClose | %Chg |
|---|---|---|
| NEWGOLD | 59,002.00 | 11.32 |
| MERVALUE | 378.40 | 10.00 |
| SIAMLETF40 | 770.11 | 10.00 |
| MORISON | 3.89 | 9.89 |
| NPFMCRFBK | 3.01 | 9.85 |
For more detailed analysis,
- On InfoWARE Market Data Terminal <TOPG> <GO>
- On InfoWARE Finance Mobile App ( Android, iPhone & iPad and Windows 10) , "Top Gainers & Losers"
Currency Market
In the currency market, the Naira appreciated 0.06%(0.84) against the Dollar to settle at 1 to 1Investment Insights - Top 5 Gainers YTD
These stocks are the best performers whose price has risen faster than the market as a whole with the best returns year to date. Momentum investors believe that stocks that have outperformed the market will often continue to do so because the factors that caused them to outperform will not suddenly disappear. In addition, other investors seeking to benefit from the stock’s outperformance will often purchase the stock, further bidding its price higher and pushing the stock higher still
For more detailed analysis,
- On InfoWARE Market Data Terminal <T5YTD2> <GO>
- On InfoWARE Finance Mobile App ( Android , iPhone & iPad and Windows 10) , "Research"
NSE: Bull Signal - Price crossed above 15 Day MA
This signal implies these stocks are under buying pressure and the price might continue to rise and therefore positions should be monitored closely. Further suggested analysis include looking at the overall market (ASI) to see if the uptrend is market wide, sector wide or specific to the stock. Portfolio managers tend to use this as a signal to do more research to add to their positions or lock in some profits. Typically further analysis should be done using commands like PC and RV on the InfoWARE Market Data Terminal. Another command is ALERTS to set price triggers for possible exit or entry as necessary
For more detailed analysis,
- On InfoWARE Market Data Terminal <NSEPERF> <GO>
- On InfoWARE Finance Mobile App ( Android , iPhone & iPad and Windows 10) , "Top Gainers & Losers"
| Symbol | Price | %Chg | 15DMA | PE | EPS | DivY | MktCap | Vol | Trades | Value | LstTradeTime |
|---|---|---|---|---|---|---|---|---|---|---|---|
| NEWGOLD | 59,002.00 | 10.17 | 56,322.06 | 0.00 | 0.00 | 0.00 | 0.00 | 21.00 | 7.00 | 1.17M | 08-Dec-2025 14:30:43.070 |
| NPFMCRFBK | 3.01 | 8.97 | 2.83 | 5.63 | 0.27 | 8.00 | 18.04B | 1.74M | 61.00 | 5.23M | 08-Dec-2025 14:30:17.843 |
| SOVRENINS | 3.17 | 8.52 | 2.97 | 27.95 | 0.03 | 3.75 | 36.03B | 3.86M | 129.00 | 11.93M | 08-Dec-2025 14:30:18.400 |
| CAVERTON | 5.35 | 8.41 | 5.16 | 1.15 | 1.57 | 5.52 | 17.93B | 1.78M | 110.00 | 9.46M | 08-Dec-2025 14:30:42.940 |
| CHAMS | 3.30 | 7.27 | 3.06 | 27.02 | 0.07 | 1.56 | 15.50B | 6.53M | 300.00 | 20.69M | 08-Dec-2025 14:30:09.687 |
| VERITASKAP | 1.87 | 6.95 | 1.75 | 48.77 | 0.02 | 4.17 | 25.93B | 4.37M | 152.00 | 7.84M | 08-Dec-2025 14:30:19.070 |
| VETBANK | 14.50 | 6.90 | 13.60 | 0.00 | 0.00 | 20.00K | 12.00 | 290.10K | 08-Dec-2025 14:30:43.103 | ||
| LIVINGTRUST | 3.61 | 6.37 | 3.55 | 35.78 | 0.02 | 1.67 | 18.05B | 843.85K | 36.00 | 2.96M | 08-Dec-2025 14:30:47.527 |
| VFDGROUP | 10.85 | 5.99 | 10.33 | 0.00 | 0.00 | 0.00 | 0.00 | 3.02M | 163.00 | 32.29M | 08-Dec-2025 14:30:19.163 |
| FTNCOCOA | 5.05 | 5.94 | 4.98 | 0.00 | 0.00 | 1.60 | 19.70B | 658.87K | 131.00 | 3.25M | 08-Dec-2025 14:30:16.023 |
| CONHALLPLC | 4.20 | 5.24 | 4.00 | 69.63 | 0.03 | 2.08 | 44.96B | 2.19M | 63.00 | 9.19M | 08-Dec-2025 14:30:09.757 |
| MANSARD | 13.50 | 4.44 | 13.04 | 31.16 | 0.24 | 4.59 | 121.50B | 1.21M | 120.00 | 16.33M | 08-Dec-2025 14:30:16.983 |
| GUINEAINS | 1.20 | 4.17 | 1.18 | 66.79 | 0.01 | 1.96 | 7.37B | 619.41K | 78.00 | 717.66K | 08-Dec-2025 14:30:16.223 |
| JAPAULGOLD | 2.18 | 3.67 | 2.16 | 0.19 | 12.01 | 0.90 | 13.65B | 63.74M | 187.00 | 139.08M | 08-Dec-2025 14:30:16.683 |
| CILEASING | 5.50 | 3.64 | 5.30 | 6.50 | 0.64 | 1.20 | 4.30B | 1.40M | 61.00 | 7.69M | 08-Dec-2025 14:30:09.717 |
| AFRIPRUD | 13.30 | 2.26 | 13.26 | 19.57 | 0.61 | 1.27 | 26.60B | 529.25K | 147.00 | 6.97M | 08-Dec-2025 14:30:09.090 |
| NGXINS | 1,118.84 | 1.80 | 1,106.60 | 10.41 | 2.09 | 0.00 | 0.00 | 57.61M | 1,789.00 | 191.62M | 08-Dec-2025 14:30:24.043 |
| BERGER | 36.45 | 1.78 | 36.16 | 14.18 | 1.22 | 1.15 | 10.56B | 589.05K | 95.00 | 21.57M | 08-Dec-2025 14:30:09.453 |
| UCAP | 17.10 | 0.58 | 17.03 | 19.15 | 0.93 | 5.03 | 102.60B | 4.67M | 287.00 | 80.46M | 08-Dec-2025 14:30:18.893 |
| LEARNAFRCA | 5.75 | 0.00 | 5.74 | 5.79 | 0.51 | 8.53 | 4.44B | 265.10K | 33.00 | 1.60M | 08-Dec-2025 14:30:16.830 |
| UNILEVER | 72.00 | 0.00 | 71.93 | 67.09 | 0.40 | 2.81 | 413.64B | 375.92K | 147.00 | 25.79M | 08-Dec-2025 14:30:18.913 |
NSE: BEAR Signal - Price crossed below 15 Day MA
This signal implies these stocks are under selling pressure and the price might continue to slide and therefore positions should be monitored closely. Further suggested analysis include looking at the overall market (ASI) to see if the downtrend is market wide, sector wide or specific to the stock. If the overal market trend is upwards, then since these stocks are heading in the opposite direction, then further analysis should be done using commands like PC and RV on the InfoWARE Market Data Terminal. Another command is ALERTS to set price triggers for possible exit is necessar
For more detailed analysis,
- On InfoWARE Market Data Terminal <BEARM> <GO>
- On InfoWARE Finance Mobile App ( Android , iPhone & iPad and Windows 10)
| Symbol | Price | %Chg | 15DMA | PE | EPS | DivY | MktCap | Vol | Trades | Value | LstTradeTime |
|---|---|---|---|---|---|---|---|---|---|---|---|
| FIDELITYBK | 19.00 | -1.05 | 19.08 | 13.24 | 1.17 | 5.48 | 550.52B | 36.91M | 678.00 | 700.71M | 08-Dec-2025 14:30:42.950 |
| LASACO | 2.55 | -1.57 | 2.58 | 21.56 | 0.11 | 4.05 | 4.68B | 3.01M | 75.00 | 7.67M | 08-Dec-2025 14:30:16.817 |
| ACCESSCORP | 21.05 | -2.14 | 21.14 | 8.56 | 2.81 | 1.87 | 748.23B | 28.58M | 1,477.00 | 611.14M | 08-Dec-2025 14:30:46.090 |
| CUSTODIAN | 38.95 | -2.44 | 39.81 | 3.80 | 3.29 | 1.20 | 229.10B | 768.85K | 127.00 | 29.27M | 08-Dec-2025 14:30:09.823 |
| OMATEK | 1.15 | -3.48 | 1.18 | 6.82 | 0.10 | 0.00 | 3.38B | 468.11K | 57.00 | 552.71K | 08-Dec-2025 14:30:17.947 |
| JAIZBANK | 4.50 | -3.56 | 4.58 | 83.05 | 0.03 | 1.67 | 155.44B | 10.99M | 596.00 | 50.12M | 08-Dec-2025 14:30:47.970 |
| DAARCOMM | 0.91 | -7.69 | 0.94 | 0.00 | 0.00 | 0.00 | 10.92B | 570.07K | 84.00 | 535.01K | 08-Dec-2025 14:30:09.920 |
| VETGRIF30 | 60.15 | -9.98 | 61.22 | 0.00 | 0.00 | 40.78K | 27.00 | 2.71M | 08-Dec-2025 14:30:43.120 |
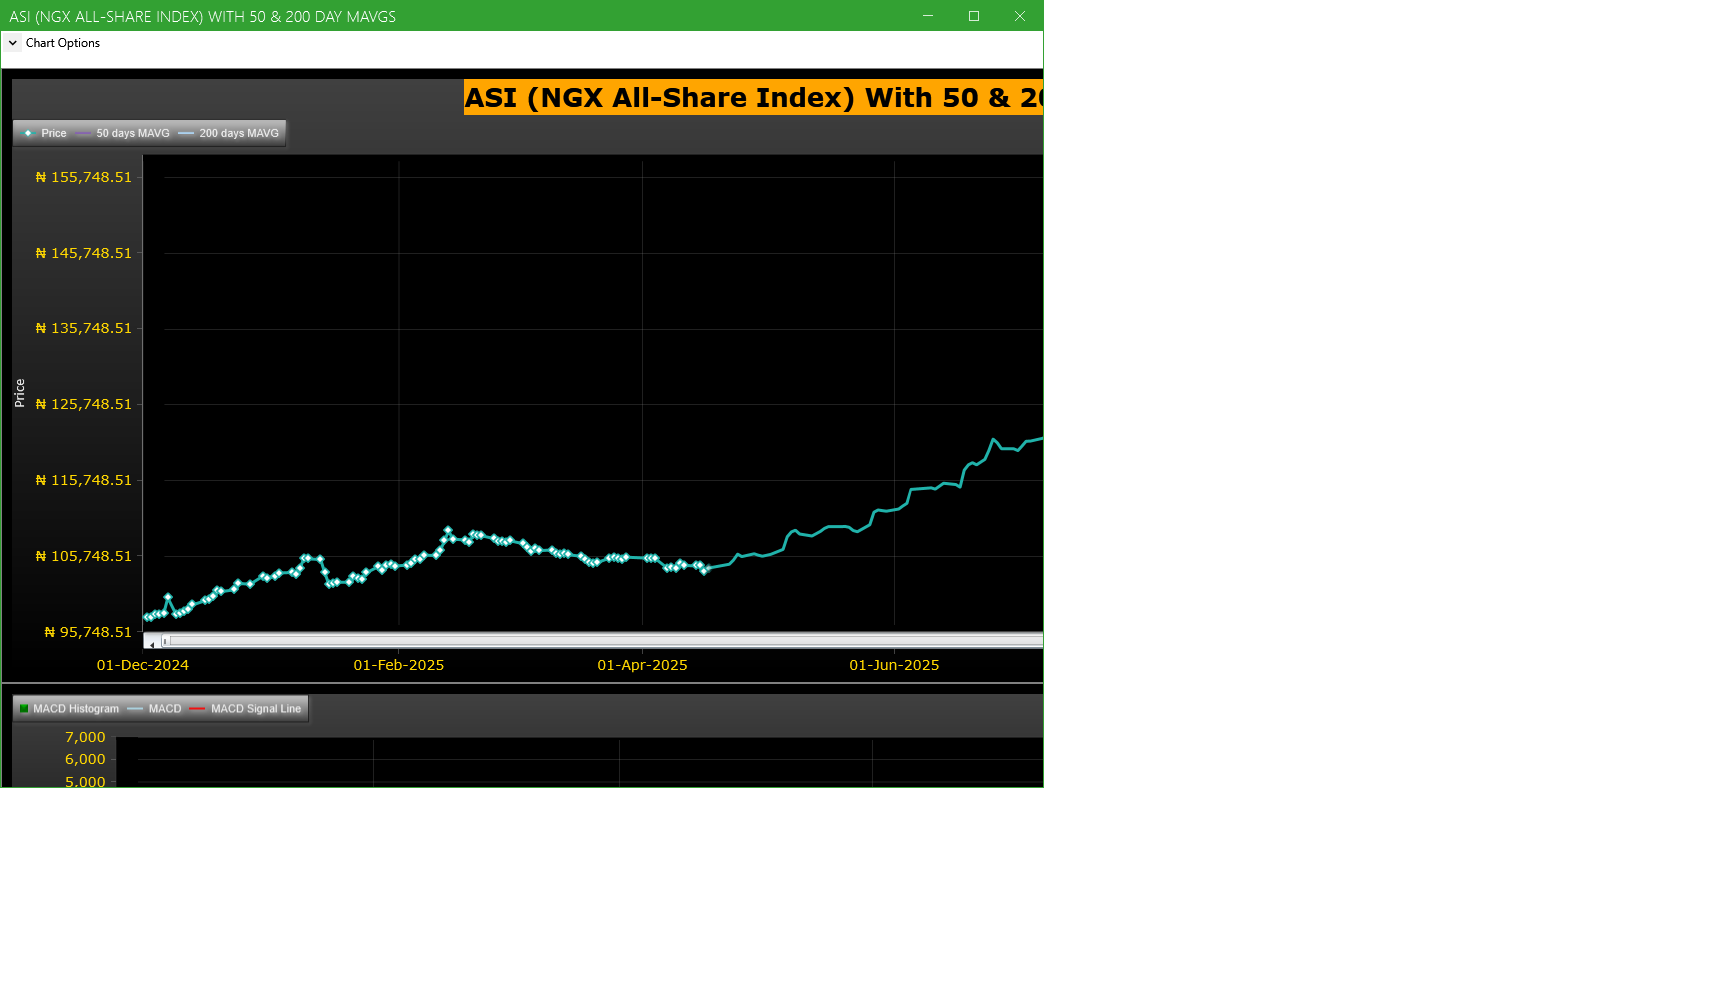
Market Trend - ASI (NGX All-Share-Index) With 50 & 200 Day MAvgs Chart
Technical traders typically use the 50 & 200 day moving averages to aid in choosing
where to enter or exit a position, which then causes these levels to act as strong
support or resistance. As a general guideline, if the price is above a moving average,
the trend is up. If the price is below a moving average, the trend is down.
It is important to note that critics of technical analysis say that moving averages act
as support and resistance because so many traders use these indicators to inform their
trading decisions. Also moving averages tend to work quite well in strong trending conditions
but poorly in choppy or ranging conditions.
Trading Strategies: Crossovers
Crossovers are one of the main moving average strategies. The first type is a price crossover,
which is when the price crosses above or below a moving average to signal a potential change
in trend. Another strategy is to apply two moving averages to a chart: one longer and one
shorter. When the shorter-term MA crosses above the longer-term MA, it is a buy signal, as
it indicates that the trend is shifting up. This is known as a golden cross. Meanwhile, when
the shorter-term MA crosses below the longer-term MA, it is a sell signal, as it indicates that
the trend is shifting down. This is known as a dead/death cross
For more detailed analysis,
- On InfoWARE Market Data Terminal <CI> <GO>
- On InfoWARE Finance Mobile App ( Android , iPhone & iPad and Windows 10) , "Research"
Unusual Volume: Volume traded is more than double the 90 day moving average (All exchanges; ASI & ASem). For more detailed analysis,
- On InfoWARE Market Data Terminal <UV> <GO>
- On InfoWARE Finance Mobile App ( Android , iPhone & iPad and Windows 10)
| Symbol | Name | Volume | 90DAvgVol | %VolChg | Price | LClose | %Chg | Trades | Value |
|---|---|---|---|---|---|---|---|---|---|
| FCMB | FCMB GROUP PLC. | 129.65M | 30.57M | 324.17 | 11.05 | 10.90 | 1.38 | 818 | 1.43B |
| JAPAULGOLD | JAPAUL GOLD & VENTURES PLC | 63.74M | 18.04M | 253.33 | 2.18 | 2.10 | 3.81 | 187 | 139.08M |
| UPDC | UPDC PLC | 24.92M | 3.16M | 688.82 | 4.80 | 4.80 | 0.00 | 316 | 120.37M |
| AIICO | AIICO INSURANCE PLC. | 20.37M | 8.99M | 126.63 | 3.55 | 3.51 | 1.14 | 590 | 73.92M |
| UPDCREIT | UPDC REAL ESTATE INVESTMENT TRUST | 9.28M | 1.98M | 369.70 | 7.00 | 6.80 | 2.94 | 235 | 64.68M |
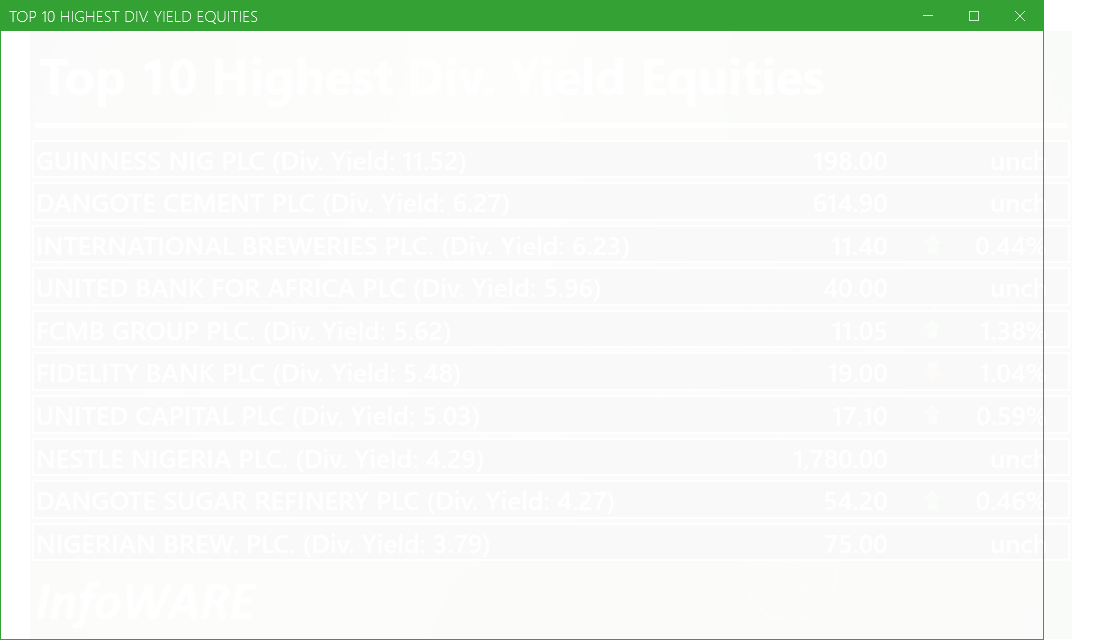
Investment Insights - High Div. Stocks
Dividend stocks distribute a portion of the company earnings to investors on a regular basis and they can a great choice for investors looking for regular income. As an investment or trading strategy, high dividend yield equities provide annual cash payments as against mostly capital gains in the price of a stock. The list in the table below represent the highest dividend paying stocks from the list of the most liquid stocks in the NSE top 30.
For more detailed analysis,
- On InfoWARE Market Data Terminal <HYIELD> <GO>
- On InfoWARE Finance Mobile App ( Android , iPhone & iPad and Windows 10) , "Research"
Investment Insights - Stocks outperforming the ASI but with approximately the same risk
These list of stocks represent equities that are less risky than the ASI but doing better than the ASI (All Shares Index) using the YTD (Year to Date) returns as the measure. The risk is measured by Beta. Beta is an assessment of a stock's tendency to undergo price changes, (its volatility), as well as its potential returns compared to the ASI. It is expressed as a ratio, where a score of 1 represents performance comparable to the ASI, and returns above or below the market may receive scores greater or lower than 1.
For a full list of both positively and negatively corelated stocks visit InfoWARE Market Data Terminal
- On InfoWARE Market Data Terminal <BANL> <GO>
- On InfoWARE Finance Mobile App ( Android , iPhone & iPad and Windows 10)
| Symbol | DivYield | PE | EPS | Beta | %ChgYTD | ASIYTDReturn | BetaDiff |
|---|---|---|---|---|---|---|---|
| HONYFLOUR | 1.40 | 16.28 | 0.31 | 0.99 | 177.46 | 42.88 | 0.01 |
| CAVERTON | 5.52 | 1.15 | 1.57 | 0.98 | 109.80 | 42.88 | 0.02 |
| ROYALEX | 7.81 | 0.00 | 0.00 | 0.96 | 78.18 | 42.88 | 0.04 |
| UNIVINSURE | 0.00 | 0.00 | 0.00 | 0.83 | 61.11 | 42.88 | 0.17 |
| FTNCOCOA | 1.60 | 0.00 | 0.00 | 0.79 | 168.62 | 42.88 | 0.21 |
| NB | 3.79 | 16.95 | 1.60 | 0.79 | 134.38 | 42.88 | 0.21 |
| MAYBAKER | 3.75 | 58.94 | 0.14 | 0.78 | 76.60 | 42.88 | 0.22 |
| UNILEVER | 2.81 | 67.09 | 0.40 | 0.75 | 100.00 | 42.88 | 0.25 |
| VETGOODS | 0.00 | 0.71 | 97.67 | 42.88 | 0.29 | ||
| VETGRIF30 | 0.00 | 0.71 | 59.34 | 42.88 | 0.29 |
African Markets
| Name | LClose | Change | %Chg |
|---|---|---|---|
| BRVM Stock Exchange | 352.87 | -0.42 | -0.12 |
| Botswana Stock Exchange | 10,792.66 | 23.69 | 0.22 |
| Egyptian Exchange | 41,499.07 | 157.10 | 0.38 |
| Lusaka Stock Exchange | 25,287.84 | 118.30 | 0.47 |
| Casablanca Stock Exchange | 18,469.38 | 82.74 | 0.45 |
| Malawi Stock Exchange | 615,346.07 | -307.83 | -0.05 |
| Nigeria Stock Exchange | 147,040.07 | 1,571.07 | 1.08 |
| Nairobi Securities Exchange | 179.58 | -2.49 | -1.37 |
| Rwanda Stock Exchange | 180.53 | -0.09 | -0.05 |
| Tunis Stock Exchange | 13,267.60 | 22.52 | 0.17 |
| Uganda Securities Exchange | 1,506.34 | -12.15 | -0.80 |
Nigeria Market Indexes
| Symbol | LClose | %Chg | WTD% | MTD% | QTD% | YTD% | MktCap | Trades |
|---|---|---|---|---|---|---|---|---|
| ASI | 147,427.92 | 0.26 | 0.00 | 2.95 | 3.11 | 42.88 | 28,567 | |
| NGX30 | 5,391.29 | 0.26 | 0.00 | 2.94 | 3.32 | 41.32 | 15,786 | |
| NGXAFRBVI | 3,272.50 | 1.33 | 0.00 | 5.10 | -7.81 | 31.91 | 5,581 | |
| NGXAFRHDYI | 21,299.52 | 0.87 | 0.00 | 2.50 | -4.32 | 25.09 | 6,995 | |
| NGXASEM | 1,392.88 | 0.00 | 0.00 | 0.00 | -9.44 | -12.05 | 3 | |
| NGXBNK | 1,439.47 | 0.94 | 0.00 | 4.06 | -5.10 | 32.37 | 6,207 | |
| NGXCG | 3,979.67 | 0.57 | 0.00 | 3.67 | -1.76 | 40.66 | 14,661 | |
| NGXCNSMRGDS | 3,477.20 | 0.08 | 0.00 | 2.68 | 2.79 | 100.49 | 4,240 | |
| NGXCOMMDTY | 1,178.64 | 0.00 | 0.00 | -0.24 | 5.06 | 17.86 | ||
| NGXGROWTH | 14,806.45 | 0.81 | 0.00 | 0.15 | -1.76 | 90.73 | 318 | |
| NGXINDUSTR | 5,527.96 | 0.28 | 0.00 | 7.76 | 9.08 | 54.77 | 2,768 | |
| NGXINS | 1,118.84 | 1.83 | 0.00 | 3.24 | -6.46 | 42.31 | 1,789 | |
| NGXLOTUSISLM | 13,021.26 | -0.07 | 0.00 | 2.04 | 9.69 | 86.88 | 5,812 | |
| NGXMAINBOARD | 7,081.87 | 0.13 | 0.00 | 1.38 | 0.53 | 41.53 | 20,844 | |
| NGXMERIGRW | 10,118.94 | 0.72 | 0.00 | 1.56 | 2.18 | 55.12 | 4,104 | |
| NGXMERIVAL | 12,923.39 | 0.87 | 0.00 | 4.93 | -3.33 | 23.90 | 7,854 | |
| NGXOILGAS | 2,684.05 | 0.00 | 0.00 | -0.46 | 6.26 | -1.00 | 408 | |
| NGXPENBRD | 2,773.21 | 0.26 | 0.00 | 2.93 | 4.61 | 51.41 | 23,849 | |
| NGXPENSION | 6,806.49 | 0.43 | 0.00 | 2.80 | 1.02 | 50.12 | 18,105 | |
| NGXPREMIUM | 14,932.97 | 0.53 | 0.00 | 6.02 | 9.07 | 53.43 | 7,405 | |
| NGXSOVBND | 673.26 | 0.00 | 0.00 | -0.03 | 2.43 | 11.92 | 0 |
For more detailed analysis,
- On InfoWARE Market Data Terminal <MKTINS> <GO>
- On InfoWARE Finance Mobile App ( Android, iPhone & iPad and Windows 10) , "Market Indexes"
Find the topic interesting? Will like to comment? Contact Us at solutions@infowarelimited.com
Top News

Chart Of The Day - ASI Chart Vs ASI Advance Decline Line (YTD) (08-Dec-2025 15:16:49.745)
InfoWARE AI Analyst Daily Market Report: 08-Dec-2025

[XNSA]>> DAILY FUND PRICE SUBMISSION - FCMB ASSET MANAGEMENT LIMITED
[VETBANK]>> DAILY INDICATIVE PRICES
[XNSA]>> RECLASSIFICATION FROM LOW PRICE STOCK GROUP TO MEDIUM PRICE STOCK GROUP
[XNSA]>> RECLASSIFICATION FROM MEDIUM PRICE STOCK GROUP TO HIGH PRICE STOCK GROU
[XNSA]>> H2 2025 BC/DR TEST
[XNSA]>> INTRODUCTION OF COMMERCIAL PAPER LISTING AND TRADING ON NGX
[LOTUSHAL15]>> DAILY INDICATIVE PRICES
[XNSA]>> EMERGING AFRICA DAILY MUTUAL FUND PRICES
[XNSA]>> CORDROS MILESTONE FUNDS' BID & OFFER PRICES
[XNSA]>> CHAMPION BREWERIES PLC: ACTIVATION OF CODE FOR TRADING IN RIGHTS
InfoWARE AI Analyst Weekly Market Report: 05-Dec-2025
Chart Of The Day - ASI Chart Vs ASI Advance Decline Line (YTD) (05-Dec-2025 15:06:53.831)
InfoWARE AI Analyst Daily Market Report: 05-Dec-2025
[XNSA]>> APPOINTMENT OF A DIRECTOR
[LOTUSHAL15]>> DAILY INDICATIVE PRICES
[VETINDETF]>> DAILY INDICATIVE PRICES
[XNSA]>> H2 2025 BC/DR TEST
[XNSA]>> DAILY FUND PRICE SUBMISSION - FCMB ASSET MANAGEMENT LIMITED
[XNSA]>> INTRODUCTION OF COMMERCIAL PAPER LISTING AND TRADING ON NGX
[STANBICETF30]>> DAILY INDICATIVE PRICES
[XNSA]>> CORDROS MILESTONE FUNDS' BID & OFFER PRICES
[XNSA]>> INVITATION TO ATTEND THE INAUGURATION OF THE ASHON CHAIRMAN MR. SEHIN
[XNSA]>> CHAMPION BREWERIES PLC: ACTIVATION OF CODE FOR TRADING IN RIGHTS
Chart Of The Day - ASI Chart Vs ASI Advance Decline Line (YTD) (04-Dec-2025 15:07:07.581)
InfoWARE AI Analyst Daily Market Report: 04-Dec-2025
[XNSA]>> OFF MARKET TRADE
[LOTUSHAL15]>> DAILY INDICATIVE PRICES
[VSPBONDETF]>> DAILY INDICATIVE PRICES
Get IDIA - the stock trading app for the modern investor
Solutions by Business
Product Suites
Company
Contacts
- 8th Floor,
- South Atlantic Petroleum Towers,
- 1 Adeola Odeku Street,
- Victoria Island,
- Lagos, Nigeria.
- Email: solutions@infowarelimited.com
Follow Us
 |
 |
 |
 |