


InfoWARE AI Analyst Daily Market Report: 03-Dec-2025 | InfoWARE Finance
Get IDIA - the stock trading app for the modern investor


InfoWARE AI Analyst Daily Market Report: 03-Dec-2025
(Source: InfoWARE Terminal, Date: 03-Dec-2025)
Dear Investor,
Daily Market Summary – Wednesday, December 3, 2025
The Nigerian stock market rebounded on Wednesday, with the NGX All-Share Index closing up by 0.27% at 144,928.36, extending its impressive YTD return of 40.84%. Despite a decline in overall market trading volume to 383.27M (from 543.87M), market turnover surged by 13.31% to ₦14.87B, signaling higher average trade values. Breadth was positive at 1.57x (47 advancers vs. 30 decliners), with a notable leadership from ETFs and select blue chips. In a contrasting mood, the naira slipped 0.18% vs the dollar to close at 1,446. Sectoral performance posted mixed signals, and technical momentum flags opportunities—and potential overheats—with several ETFs and a handful of equities at or near overbought zones.
Key Market Trends:
- Market Breadth & Turnover: Positive breadth (1.57x advancers/decliners) alongside lower total volume but higher turnover implies accumulation in larger tickers and possible sector rotation.
- Top Gainer: NEWGOLD ETF soared 22.27% to ₦63,578.90; notable for its ongoing appeal as a currency hedge amid naira weakness.
- Top Loser: GUINNESS reversed 10.00% to ₦198, closing with high RSI (41.3) but remains in top gainers over 5 days—a key volatility signal.
- Volume Movers:
- ETI (Ecobank): 1,864% surge in volume; slipped 1.88%, price crossed below 15DMA—possible institutional repositioning or rotation.
- MORISON & ALEX: Massive volume spikes but no price gains—caution for retail; possible distribution.
- Bullish Momentum:
- Indices and big banks (UBA, GUINNESS, VETGRIF30) closed above their 15DMA, with UBA sustained in bullish mode by a solid PE of 8.29 and dividend yield of 5.96%.
- STANBICETF30 at an RSI of 84.8—deeply overbought—is a lightning rod for technical pullback speculation.
- Bearish Momentum:
- ETI and ROYALEX signaled further downside with prices crossing below 15DMA amid high volume—a red flag for continuation of downtrend.
YTD Top 5 Gainers
| Name | Symbol | Price | %ChgYTD | %Chg5Dys | RSI | Notes |
|---|---|---|---|---|---|---|
| STANBIC IBTC ETF 30 | STANBICETF30 | 1,267.42 | 277.82 | 33.03 | 84.82 | Extreme overbought, recent surge—potential blow-off top risk |
| NCR (NIGERIA) PLC | NCR | 66.10 | 1,221.82 | 33.03 | 99.60 | Massive YTD winner, extreme RSI |
| GUINNESS NIG PLC | GUINNESS | 180.00 | 181.85 | 18.56 | 41.31 | Today’s pullback; still a 5-day outlier |
| VETIVA INDUSTRIAL ETF | VETINDETF | 56.00 | 47.19 | 18.46 | 43.47 | ETF demand theme |
| VETIVA CONSUMER GOODS ETF | VETGOODS | 41.80 | 161.63 | 18.42 | 65.12 | ETF trend persists |
YTD Top 5 Losers
| Name | Symbol | Price | %ChgYTD | %Chg5Dys | RSI | Notes |
|---|---|---|---|---|---|---|
| GREENWICH ASSET ETF | GREENWETF | 270.00 | -48.50 | -12.70 | 27.05 | New recent lows, oversold |
| LEGEND INTERNET PLC | LEGENDINT | 5.00 | -19.35 | -10.71 | 50.27 | Bouncing after deep selling |
| RT BRISCOE PLC | RTBRISCOE | 3.10 | 12.73 | -9.88 | 43.81 | Bearish trend, but not YTD negative |
| LIVINGTRUST MORTGAGE BANK PLC | LIVINGTRUST | 3.23 | -26.25 | -9.78 | 33.31 | Bank/Finance under pressure |
| WAPIC INSURANCE PLC | WAPIC | 2.36 | -4.45 | -8.53 | 40.43 | Insurer - remains weak |
Momentum Insights
- Overbought/Bullish Flags:
- STANBICETF30 (RSI: 84.8, MACD: strong positive, Price >> 15DMA, 50DMA) – Warning for mean-reversion traders; profit-taking likely soon.
- NCR extreme RSI (99.60) and 33% move over 5 days – poised for volatility or institutional rebalancing.
- GUINNESS: Despite being today's top loser, still shows positive technicals (above 15DMA, solid PE and Dividend Yield), suggesting dip-buying could emerge.
- Bearish Momentum:
- LEGENDINT and GREENWETF—both YTD losers—remain weak; LEGENDINT’s breakdown below 15DMA hints at trend persistence.
- MAYBAKER, ROYALEX, LASACO: Bearish crossovers amid tepid RSI/volume, indicating sticky downtrends.
- Volume Surprises:
- ETI: Volume up 1,864%, bearish close; strong sign of distribution. Watch for continued weakness unless supported by news/catalysts.
- MORISON, ALEX: Huge volume but flat prices; textbook institutional offload or market-making activity—avoid chasing without confirming news.
Contrarian Signals
- CHAMPION BREW (CHAMPION): RSI 54.4 (neutral); despite -9.8% YTD, showing bullish MACD and 15DMA > 50DMA—classic reversal setup for contrarian traders.
- NCR: Extremely high RSI and price momentum, but fundamentals (EPS = 0.00, PE = 61.22) could signal an overheated move—be wary of fast reversals.
- NEWGOLD ETF: Trading up 22.27%, but with medium RSI (55), still has room—yet volume patterns warn of potential sudden reversals if global gold sentiment shifts.
- ETI: Massive volume spike but bearish signal, with price drop and below 15DMA; market disagreeing with liquidity—contrarian opportunity for short-term rebound, but risky.
Sector Heatmap
| Sector | Performance | Technical Trend | Retail/Institutional Interest |
|---|---|---|---|
| Banking | +0.64% | Bullish, led by UBA, GTCO, & ZENITHBANK (most above 15DMA) | ZENITHBANK dominates Institutional (2.9% by vol), features in both Institutional and Retail top lists. |
| Insurance | Mixed/Weak | Bearish (ROYAL EX, LASACO: below 15DMA) | Retail investors visible; no outperformance. |
| ETFs | Strong up-moves | Bullish, some overbought (STANBICETF30, MERVALUE) | Preferred by institutions, hedging theme. |
| Telecommunications | Flat | Neutral/Weak (MTNN: below 15DMA) | Heavy institutional turnover, retail trading steady |
| Consumer Goods | Mildly positive | GUINNESS flagged as swing volatility; Livestock Feeds showing volume uptick. | Retail focused |
Dividend-Beta Matrix (Defensive Screen)
| Stock | Dividend Yield (%) | Beta | Momentum Table? | Commentary |
|---|---|---|---|---|
| UBA | 5.96 | 1.56 | Bullish (above 15DMA) | Strong risk-reward: solid yield, positive price trend, but higher beta. |
| NSLTECH | 15.87 | 0.68 | Bullish (above 15DMA) | Ultra-high yield, low beta: classic defensive candidate but illiquidity risk. |
| NEIMETH | 3.38 | 0.25 | Bullish (above 15DMA) | Pharma with yield, low risk—watch for breakout and potential accumulation. |
| GUINNESS | 11.52 | 0.33 | Both top gainer (5d) and top loser (today); flagged in momentum | Attracts yield investors; recent pullback is dip watch. |
- Defensive Plays: GUINNESS, UBA, NSLTECH, NEIMETH offer attractive risk-adjusted returns—particularly for yield-seeking portfolios—with additional press from technical upturns.
- Implication: High dividend, low beta names with bullish momentum may outperform in volatile phases; but overbought signals (e.g., extreme RSI) temper return expectations—plan entry points accordingly.
Institutional Clustering Alerts
- ZENITHBANK: Institutions controlled 20.17% of trade value; dual presence in both retail and institutional lists suggests "crowded" trade—be wary of sharp pivots if sentiment changes.
- GTCO, MTNN, WAPCO, NESTLE: All posted high-value institutional trades, with little retail overlap—suggesting institutional accumulation or distribution.
- Retail Focus: ACCESSCORP, HONYFLOUR, and UBA had high trade counts by retail but lower average ticket sizes; potentially more momentum-chasing than value-based entry.
Market Activity/Trades Insights
- Institutions: Although only 24.2% of total trade count, accounted for a dominant 82.56% of trade value and 58.02% of volume—pointing to large block trades, primarily in banks and blue chips (ZENITHBANK, GTCO, NESTLE, WAPCO, MTNN).
- Retail: Comprise the majority by trade count (75.81%) but only 17.44% of value—reflecting smaller ticket sizes. Names like ACCESSCORP and HONYFLOUR were particularly favored by retail investors.
- Pattern: ZENITHBANK consistently traded in large volumes by both groups, suggesting strong liquidity and possible sector leadership or hedging flows.
- Volume Alerts: Exceptions such as ETI’s massive volume (possible institutional distribution) and MORISON/ALEX’s volume spikes (potential rotation or circular trading) should prompt analysis for non-fundamental activity or potential volatility.
Suggestions for Traders
- Opportunities: Consider rotational plays into top ETF movers (VETGOODS, VETINDETF, VETGRIF30) but use trailing stops, as many show overbought RSIs.
- Bulls may want to watch for dip-buying in GUINNESS and UBA, especially on sustained above-15DMA closes and high dividend yields.
- Caution: Avoid chasing ETI and top volume outliers in the absence of fundamental catalysts; possible distribution or "exit liqudity" events.
- Overbought/Profit-Taking Levels: STANBICETF30, NCR, and other high RSI stocks are primed for reversal or at least volatility spikes—scale positions as needed.
- Institutional magnets: ZENITHBANK and GTCO remain logical hedges and liquidity refuges, but crowding risk means faster slippage if sentiment sours.
- Contrarian Watch: CHAMPION, LEGENDINT, and other stocks exhibiting conflicting technicals may see swift reversals—consider short-term tactical trades but remain nimble.
Hidden Insights & Key Takeaways
- Institutional flows are dominating sector leadership (banking, blue chip ETFs), but with small caps essentially orphaned in volume spikes and reversals.
- Retail investors chase high-volatility names. When institutional and retail patterns overlap (as with ZENITHBANK), it’s both a validation and a warning.
- High dividend stocks with bullish technicals (GUINNESS, NSLTECH, NEIMETH, UBA) offer unique defensive angles, especially amid volatility, but only with disciplined entry/exit.
- Extreme RSI flags (STANBICETF30, NCR) deserve monitoring for mean reversion, while bearish momentum laggards may finally see rotation as the market stabilizes or advance slows.
- Unusual volumes—especially with price down—should cause pause; not all liquidity is positive for near-term holders.
Final Word: The market’s upward grind is intact, but risk signals—overbought conditions, ETF froth, and institutional clustering—call for rotation and active management. Mind your stops and keep positioning nimble as the year-end approaches.
|
Top ASI Gainers Over Last 5 Trading Days
|
Top ASI Losers Over Last 5 Trading Days
|
For more detailed analysis, on InfoWARE Market Data Terminal <NSEPERF> <GO>
On InfoWARE Finance Mobile App (Android, iPhone & iPad, Windows Phone and Windows 8/10), "Top Gainers & Losers"
NEWGOLD EXCHANGE TRADED FUND (ETF) (NEWGOLD) topped the advancers list closing at N63,578.90 with a gain of 22.27% followed by GUINNESS NIG PLC (GUINNESS) which closed at N198.00 with a gain of 10.00%.
On the flip side VETIVA BANKING ETF (VETBANK) and VERITAS KAPITAL ASSURANCE PLC (VERITASKAP) topped the decliners log with a loss of -9.09% at a close of N13.50, and -4.47% to close the day at N1.71 respectively.
| Symbol | LClose | %Chg |
|---|---|---|
| NEWGOLD | 63,578.90 | 22.27 |
| GUINNESS | 198.00 | 10.00 |
| MERVALUE | 286.00 | 10.00 |
| VETINDETF | 61.60 | 10.00 |
| STANBICETF30 | 1,394.16 | 10.00 |
| Symbol | LClose | %Chg |
|---|---|---|
| VETBANK | 13.50 | -9.09 |
| VERITASKAP | 1.71 | -4.47 |
| LASACO | 2.55 | -3.77 |
| PRESTIGE | 1.60 | -3.03 |
| ROYALEX | 1.90 | -2.56 |
For more detailed analysis,
- On InfoWARE Market Data Terminal <TOPG> <GO>
- On InfoWARE Finance Mobile App ( Android, iPhone & iPad and Windows 10) , "Top Gainers & Losers"
Currency Market
In the currency market, the Naira fell 0.18%(-2.57) against the Dollar to settle at 1 to 1NSE: Bull Signal - Price crossed above 15 Day MA
This signal implies these stocks are under buying pressure and the price might continue to rise and therefore positions should be monitored closely. Further suggested analysis include looking at the overall market (ASI) to see if the uptrend is market wide, sector wide or specific to the stock. Portfolio managers tend to use this as a signal to do more research to add to their positions or lock in some profits. Typically further analysis should be done using commands like PC and RV on the InfoWARE Market Data Terminal. Another command is ALERTS to set price triggers for possible exit or entry as necessary
For more detailed analysis,
- On InfoWARE Market Data Terminal <NSEPERF> <GO>
- On InfoWARE Finance Mobile App ( Android , iPhone & iPad and Windows 10) , "Top Gainers & Losers"
| Symbol | Price | %Chg | 15DMA | PE | EPS | DivY | MktCap | Vol | Trades | Value | LstTradeTime |
|---|---|---|---|---|---|---|---|---|---|---|---|
| GUINNESS | 198.00 | 9.09 | 170.13 | 31.75 | 1.95 | 11.52 | 433.70B | 2.83M | 159.00 | 560.38M | 03-Dec-2025 14:30:07.380 |
| VETINDETF | 61.60 | 9.09 | 57.99 | 0.00 | 0.00 | 21.24K | 33.00 | 1.26M | 03-Dec-2025 14:30:18.540 | ||
| VETGRIF30 | 66.83 | 8.98 | 59.79 | 0.00 | 0.00 | 14.38K | 17.00 | 846.10K | 03-Dec-2025 14:30:18.530 | ||
| UBA | 39.60 | 3.03 | 37.78 | 8.29 | 4.05 | 5.96 | 1,354.30B | 16.47M | 883.00 | 642.30M | 03-Dec-2025 14:30:18.620 |
| NSLTECH | 0.83 | 2.41 | 0.81 | 0.00 | 0.00 | 15.87 | 4.67B | 691.17K | 57.00 | 570.71K | 03-Dec-2025 14:30:07.850 |
| NEIMETH | 5.50 | 1.82 | 5.40 | 125.52 | 0.02 | 3.38 | 23.50B | 413.53K | 67.00 | 2.29M | 03-Dec-2025 14:30:07.760 |
| NGXMERIVAL | 12,548.13 | 1.14 | 12,435.25 | 12.13 | 38.38 | 0.00 | 0.00 | 127.68M | 4,565.00 | 6.54B | 03-Dec-2025 14:30:11.493 |
| NGXAFRBVI | 3,158.91 | 0.98 | 3,138.71 | 3.14 | 35.50 | 0.00 | 0.00 | 155.72M | 4,041.00 | 7.82B | 03-Dec-2025 14:30:11.387 |
| NGXCG | 3,886.17 | 0.71 | 3,862.29 | 443.35 | 327.97 | 0.00 | 0.00 | 204.18M | 10,158.00 | 11.21B | 03-Dec-2025 14:30:11.420 |
| NGXBNK | 1,394.95 | 0.64 | 1,391.18 | 6.10 | 34.65 | 0.00 | 0.00 | 215.35M | 5,477.00 | 9.19B | 03-Dec-2025 14:30:11.410 |
| NGXINDUSTR | 5,375.40 | 0.47 | 5,255.48 | 39.90 | 18.97 | 0.00 | 0.00 | 5.76M | 1,838.00 | 269.50M | 03-Dec-2025 14:30:11.453 |
| NGXCNSMRGDS | 3,436.25 | 0.38 | 3,435.22 | 30.19 | 55.24 | 0.00 | 0.00 | 12.85M | 2,468.00 | 1.03B | 03-Dec-2025 14:30:11.430 |
| NGXPENBRD | 2,731.17 | 0.27 | 2,710.63 | 348.78 | 389.18 | 0.00 | 0.00 | 314.84M | 16,664.00 | 14.20B | 03-Dec-2025 14:30:11.510 |
| ASI | 145,323.87 | 0.27 | 144,534.07 | 11.84 | 457.69 | 0.00 | 0.00 | 383.27M | 20,239.00 | 14.87B | 03-Dec-2025 14:30:11.370 |
| NGXPREMIUM | 14,552.00 | 0.26 | 14,217.92 | 2,048.74 | 238.70 | 0.00 | 0.00 | 125.73M | 5,757.00 | 6.63B | 03-Dec-2025 14:30:11.523 |
| NGX30 | 5,310.43 | 0.19 | 5,289.10 | 575.61 | 329.08 | 0.00 | 0.00 | 226.41M | 11,710.00 | 12.95B | 03-Dec-2025 14:30:11.377 |
| DANGCEM | 588.00 | 0.00 | 550.04 | 761.31 | 0.63 | 6.27 | 10,019.82B | 165.48K | 736.00 | 97.85M | 03-Dec-2025 14:30:18.567 |
| FGSUK2027S3 | 90.00 | 0.00 | 86.24 | 0.00 | 0.00 | 0.00 | 0.00 | 0.00 | 03-Dec-2025 14:30:20.630 | ||
| LIVESTOCK | 6.50 | 0.00 | 6.46 | 0.00 | 0.00 | 2.94 | 19.50B | 279.05K | 55.00 | 1.79M | 03-Dec-2025 14:30:07.577 |
| TAJSUKS2 | 100.00 | 0.00 | 99.63 | 0.00 | 0.00 | 1.00 | 1.00 | 999.99 | 03-Dec-2025 14:30:20.760 | ||
| NGXLOTUSISLM | 12,919.71 | -0.09 | 12,851.69 | 1,270.93 | 62.77 | 0.00 | 0.00 | 8.91M | 4,455.00 | 2.13B | 03-Dec-2025 14:30:11.470 |
NSE: BEAR Signal - Price crossed below 15 Day MA
This signal implies these stocks are under selling pressure and the price might continue to slide and therefore positions should be monitored closely. Further suggested analysis include looking at the overall market (ASI) to see if the downtrend is market wide, sector wide or specific to the stock. If the overal market trend is upwards, then since these stocks are heading in the opposite direction, then further analysis should be done using commands like PC and RV on the InfoWARE Market Data Terminal. Another command is ALERTS to set price triggers for possible exit is necessar
For more detailed analysis,
- On InfoWARE Market Data Terminal <BEARM> <GO>
- On InfoWARE Finance Mobile App ( Android , iPhone & iPad and Windows 10)
| Symbol | Price | %Chg | 15DMA | PE | EPS | DivY | MktCap | Vol | Trades | Value | LstTradeTime |
|---|---|---|---|---|---|---|---|---|---|---|---|
| JAPAULGOLD | 2.17 | 2.30 | 2.18 | 0.19 | 12.01 | 0.90 | 13.59B | 5.36M | 168.00 | 11.24M | 03-Dec-2025 14:30:07.480 |
| FCMB | 10.50 | 0.00 | 10.65 | 104.31 | 0.09 | 5.62 | 207.93B | 17.29M | 491.00 | 179.10M | 03-Dec-2025 14:30:07.260 |
| LEGENDINT | 5.00 | 0.00 | 5.54 | 0.00 | 0.00 | 107.92K | 26.00 | 541.91K | 03-Dec-2025 14:30:07.547 | ||
| LINKASSURE | 1.76 | 0.00 | 1.79 | 59.89 | 0.02 | 5.56 | 24.64B | 108.31K | 27.00 | 199.67K | 03-Dec-2025 14:30:07.560 |
| MAYBAKER | 16.20 | 0.00 | 17.05 | 58.94 | 0.14 | 3.75 | 27.95B | 804.24K | 66.00 | 13.07M | 03-Dec-2025 14:30:07.623 |
| MTNN | 470.60 | 0.00 | 470.72 | 16,715.80 | 0.01 | 3.29 | 9,578.83B | 1.34M | 1,413.00 | 633.14M | 03-Dec-2025 14:30:18.593 |
| TANTALIZER | 2.30 | 0.00 | 2.37 | 0.00 | 0.00 | 1.50 | 7.39B | 2.96M | 134.00 | 6.81M | 03-Dec-2025 14:30:18.420 |
| TIP | 11.00 | -0.45 | 11.04 | 0.00 | 9.79B | 2.42M | 219.00 | 26.46M | 03-Dec-2025 14:30:20.137 | ||
| ETI | 34.00 | -1.91 | 34.61 | 5.00 | 5.10 | 2.00 | 623.88B | 20.96M | 95.00 | 712.67M | 03-Dec-2025 14:30:07.220 |
| ROYALEX | 1.90 | -2.63 | 1.95 | 0.00 | 0.00 | 7.81 | 9.78B | 1.22M | 30.00 | 2.36M | 03-Dec-2025 14:30:09.133 |
| LASACO | 2.55 | -3.92 | 2.56 | 21.56 | 0.11 | 4.05 | 4.68B | 2.70M | 43.00 | 6.82M | 03-Dec-2025 14:30:07.523 |
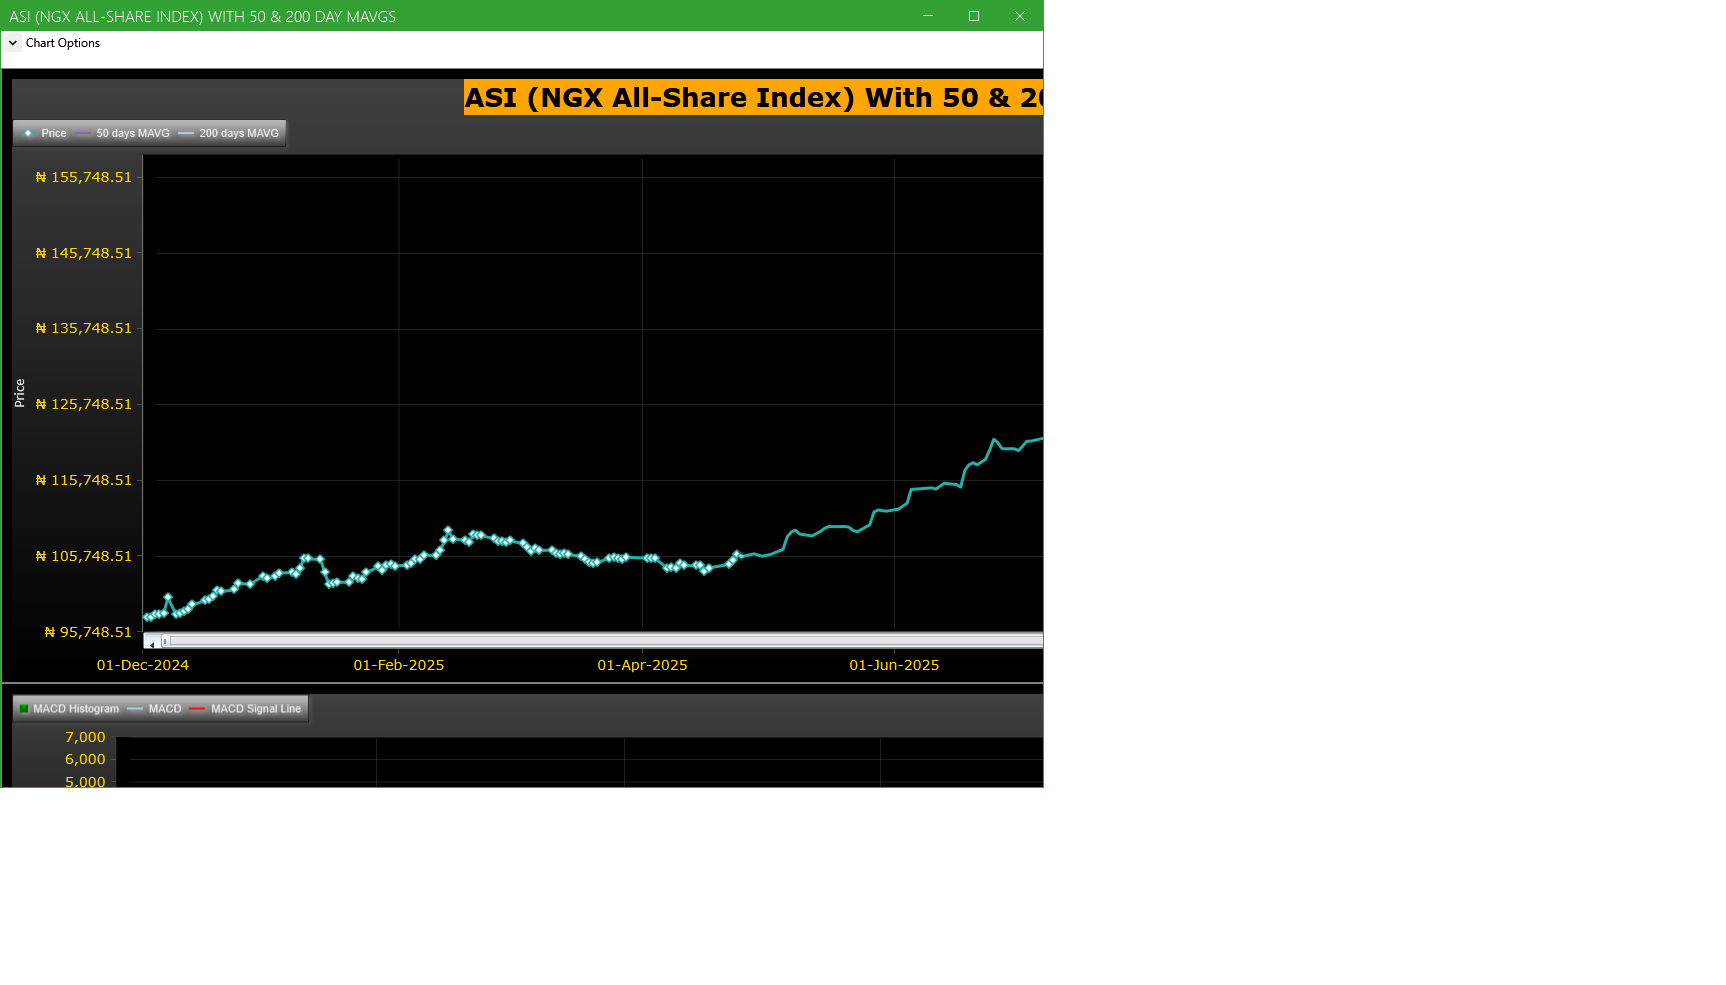
Market Trend - ASI (NGX All-Share-Index) With 50 & 200 Day MAvgs Chart
Technical traders typically use the 50 & 200 day moving averages to aid in choosing
where to enter or exit a position, which then causes these levels to act as strong
support or resistance. As a general guideline, if the price is above a moving average,
the trend is up. If the price is below a moving average, the trend is down.
It is important to note that critics of technical analysis say that moving averages act
as support and resistance because so many traders use these indicators to inform their
trading decisions. Also moving averages tend to work quite well in strong trending conditions
but poorly in choppy or ranging conditions.
Trading Strategies: Crossovers
Crossovers are one of the main moving average strategies. The first type is a price crossover,
which is when the price crosses above or below a moving average to signal a potential change
in trend. Another strategy is to apply two moving averages to a chart: one longer and one
shorter. When the shorter-term MA crosses above the longer-term MA, it is a buy signal, as
it indicates that the trend is shifting up. This is known as a golden cross. Meanwhile, when
the shorter-term MA crosses below the longer-term MA, it is a sell signal, as it indicates that
the trend is shifting down. This is known as a dead/death cross
For more detailed analysis,
- On InfoWARE Market Data Terminal <CI> <GO>
- On InfoWARE Finance Mobile App ( Android , iPhone & iPad and Windows 10) , "Research"
Unusual Volume: Volume traded is more than double the 90 day moving average (All exchanges; ASI & ASem). For more detailed analysis,
- On InfoWARE Market Data Terminal <UV> <GO>
- On InfoWARE Finance Mobile App ( Android , iPhone & iPad and Windows 10)
| Symbol | Name | Volume | 90DAvgVol | %VolChg | Price | LClose | %Chg | Trades | Value |
|---|---|---|---|---|---|---|---|---|---|
| ETI | ECOBANK TRANSNATIONAL INCORPORATED | 20.96M | 1.07M | 1,864.35 | 34.00 | 34.65 | -1.88 | 95 | 712.67M |
| UPDCREIT | UPDC REAL ESTATE INVESTMENT TRUST | 3.75M | 1.71M | 119.35 | 6.70 | 6.80 | -1.47 | 222 | 25.09M |
| SEPLAT | SEPLAT PETROLEUM DEVELOPMENT COMPANY LTD | 181.33K | 62.96K | 188.02 | 5,809.00 | 5,809.00 | 0.00 | 159 | 948.00M |
| ALEX | ALUMINIUM EXTRUSION IND. PLC. | 118.50K | 25.56K | 363.71 | 7.15 | 7.15 | 0.00 | 4 | 764.36K |
| MORISON | MORISON INDUSTRIES PLC. | 110.66K | 13.42K | 724.36 | 3.22 | 3.22 | 0.00 | 4 | 377.45K |
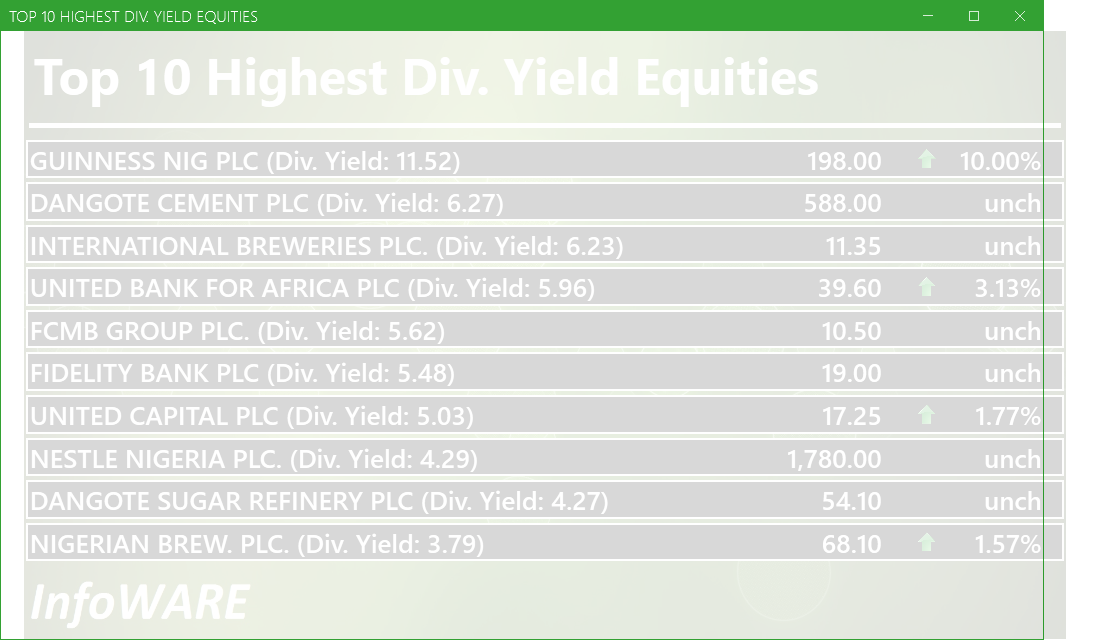
Investment Insights - High Div. Stocks
Dividend stocks distribute a portion of the company earnings to investors on a regular basis and they can a great choice for investors looking for regular income. As an investment or trading strategy, high dividend yield equities provide annual cash payments as against mostly capital gains in the price of a stock. The list in the table below represent the highest dividend paying stocks from the list of the most liquid stocks in the NSE top 30.
For more detailed analysis,
- On InfoWARE Market Data Terminal <HYIELD> <GO>
- On InfoWARE Finance Mobile App ( Android , iPhone & iPad and Windows 10) , "Research"
Investment Insights - Stocks outperforming the ASI but with approximately the same risk
These list of stocks represent equities that are less risky than the ASI but doing better than the ASI (All Shares Index) using the YTD (Year to Date) returns as the measure. The risk is measured by Beta. Beta is an assessment of a stock's tendency to undergo price changes, (its volatility), as well as its potential returns compared to the ASI. It is expressed as a ratio, where a score of 1 represents performance comparable to the ASI, and returns above or below the market may receive scores greater or lower than 1.
For a full list of both positively and negatively corelated stocks visit InfoWARE Market Data Terminal
- On InfoWARE Market Data Terminal <BANL> <GO>
- On InfoWARE Finance Mobile App ( Android , iPhone & iPad and Windows 10)
| Symbol | DivYield | PE | EPS | Beta | %ChgYTD | ASIYTDReturn | BetaDiff |
|---|---|---|---|---|---|---|---|
| HONYFLOUR | 1.40 | 16.28 | 0.31 | 0.99 | 164.45 | 40.84 | 0.01 |
| CAVERTON | 5.52 | 1.15 | 1.57 | 0.98 | 101.96 | 40.84 | 0.02 |
| ROYALEX | 7.81 | 0.00 | 0.00 | 0.96 | 72.73 | 40.84 | 0.04 |
| CORNERST | 5.28 | 8.62 | 0.35 | 0.93 | 41.41 | 40.84 | 0.07 |
| UNIVINSURE | 0.00 | 0.00 | 0.00 | 0.83 | 59.72 | 40.84 | 0.17 |
| FTNCOCOA | 1.60 | 0.00 | 0.00 | 0.79 | 147.34 | 40.84 | 0.21 |
| NB | 3.79 | 16.95 | 1.60 | 0.79 | 112.81 | 40.84 | 0.21 |
| MAYBAKER | 3.75 | 58.94 | 0.14 | 0.78 | 72.34 | 40.84 | 0.22 |
| UNILEVER | 2.81 | 67.09 | 0.40 | 0.75 | 100.00 | 40.84 | 0.25 |
| VETGOODS | 0.00 | 0.71 | 161.63 | 40.84 | 0.29 |
African Markets
| Name | LClose | Change | %Chg |
|---|---|---|---|
| BRVM Stock Exchange | 354.14 | 8.23 | 2.38 |
| Botswana Stock Exchange | 10,732.24 | 26.76 | 0.25 |
| Egyptian Exchange | 40,753.45 | 712.72 | 1.78 |
| Ghana Stock Exchange | 8,610.70 | 0.86 | 0.01 |
| Johannesburg Stock Exchange | 111,947.90 | 987.55 | 0.89 |
| Lusaka Stock Exchange | 25,158.10 | -10.07 | -0.04 |
| Casablanca Stock Exchange | 18,434.92 | -169.30 | -0.91 |
| Malawi Stock Exchange | 619,382.11 | 61.93 | 0.01 |
| Nigeria Stock Exchange | 143,210.33 | -315.76 | -0.22 |
| Nairobi Securities Exchange | 181.45 | 0.40 | 0.22 |
| Namibian Stock Exchange | 2,017.01 | 18.59 | 0.93 |
| Rwanda Stock Exchange | 179.20 | 0.00 | 0.00 |
| Tunis Stock Exchange | 13,177.24 | 5.27 | 0.04 |
| Uganda Securities Exchange | 1,546.23 | -0.62 | -0.04 |
Nigeria Market Indexes
| Symbol | LClose | %Chg | WTD% | MTD% | QTD% | YTD% | MktCap | Trades |
|---|---|---|---|---|---|---|---|---|
| ASI | 145,323.87 | 0.27 | 1.48 | 1.48 | 1.64 | 40.84 | 20,239 | |
| NGX30 | 5,310.43 | 0.19 | 1.40 | 1.40 | 1.77 | 39.21 | 11,710 | |
| NGXAFRBVI | 3,158.91 | 0.99 | 1.45 | 1.45 | -11.01 | 27.33 | 4,041 | |
| NGXAFRHDYI | 20,884.27 | 0.78 | 0.50 | 0.50 | -6.18 | 22.65 | 5,212 | |
| NGXASEM | 1,392.88 | 0.00 | 0.00 | 0.00 | -9.44 | -12.05 | 2 | |
| NGXBNK | 1,394.95 | 0.65 | 0.84 | 0.84 | -8.03 | 28.28 | 5,477 | |
| NGXCG | 3,886.17 | 0.71 | 1.24 | 1.24 | -4.07 | 37.36 | 10,158 | |
| NGXCNSMRGDS | 3,436.25 | 0.38 | 1.47 | 1.47 | 1.58 | 98.13 | 2,468 | |
| NGXCOMMDTY | 1,178.64 | -0.24 | -0.24 | -0.24 | 5.06 | 17.86 | 1,600 | |
| NGXGROWTH | 14,617.04 | -0.06 | -1.13 | -1.13 | -3.02 | 88.29 | 323 | |
| NGXINDUSTR | 5,375.40 | 0.47 | 4.79 | 4.79 | 6.07 | 50.50 | 1,838 | |
| NGXINS | 1,088.44 | 0.27 | 0.43 | 0.43 | -9.00 | 38.44 | 1,109 | |
| NGXLOTUSISLM | 12,919.71 | -0.09 | 1.24 | 1.24 | 8.83 | 85.42 | 4,455 | |
| NGXMAINBOARD | 7,022.59 | 0.28 | 0.53 | 0.53 | -0.31 | 40.34 | 13,816 | |
| NGXMERIGRW | 9,927.99 | 0.24 | -0.35 | -0.35 | 0.25 | 52.19 | 2,634 | |
| NGXMERIVAL | 12,548.13 | 1.15 | 1.89 | 1.89 | -6.13 | 20.30 | 4,565 | |
| NGXOILGAS | 2,684.05 | -0.47 | -0.46 | -0.46 | 6.26 | -1.00 | 1,281 | |
| NGXPENBRD | 2,731.17 | 0.28 | 1.37 | 1.37 | 3.02 | 49.11 | 16,664 | |
| NGXPENSION | 6,674.48 | 0.38 | 0.81 | 0.81 | -0.94 | 47.21 | 12,587 | |
| NGXPREMIUM | 14,552.00 | 0.26 | 3.31 | 3.31 | 6.28 | 49.51 | 5,757 | |
| NGXSOVBND | 673.26 | 0.00 | -0.03 | -0.03 | 2.43 | 11.92 | 0 |
For more detailed analysis,
- On InfoWARE Market Data Terminal <MKTINS> <GO>
- On InfoWARE Finance Mobile App ( Android, iPhone & iPad and Windows 10) , "Market Indexes"
Find the topic interesting? Will like to comment? Contact Us at solutions@infowarelimited.com
Top News

Chart Of The Day - ASI Chart Vs ASI Advance Decline Line (YTD) (03-Dec-2025 15:16:32.968)
InfoWARE AI Analyst Daily Market Report: 03-Dec-2025

[XNSA]>> INVITATION TO ATTEND THE INAUGURATION OF THE ASHON CHAIRMAN MR. SEHIN
[XNSA]>> OFF MARKET TRADE
[VSPBONDETF]>> DAILY INDICATIVE PRICES
[XNSA]>> CORDROS MILESTONE FUNDS' BID & OFFER PRICES
[XNSA]>> H2 2025 BC/DR TEST
[XNSA]>> LISTING OF FGN SAVINGS BONDS FOR NOVEMBER 2025
[XNSA]>> CHAMPION BREWERIES PLC: ACTIVATION OF CODE FOR TRADING IN RIGHTS
InfoWARE AI Analyst Daily Market Report: 01-Dec-2025
Chart Of The Day - ASI Chart Vs ASI Advance Decline Line (YTD) (01-Dec-2025 15:06:56.747)
InfoWARE AI Analyst Daily Market Report: 01-Dec-2025
[SIAMLETF40]>> DAILY INDICATIVE PRICES
[VETGOODS]>> DAILY INDICATIVE PRICES
[XNSA]>> OFF MARKET TRADE
[XNSA]>> EMERGING AFRICA DAILY MUTUAL FUND PRICES
[XNSA]>> H2 2025 BC/DR TEST
[XNSA]>>GO-LIVE NOTIFICATION: TRANSITION TO T+2 SETTLEMENT CYCLE
InfoWARE AI Analyst Weekly Market Report: 28-Nov-2025
Chart Of The Day - ASI Chart Vs ASI Advance Decline Line (YTD) (28-Nov-2025 15:06:42.196)
InfoWARE AI Analyst Daily Market Report: 28-Nov-2025
Breaking News! Unusual Volume Alert (28-Nov-2025 14:21:07.760)
Breaking News! Bulls Momentum Alert (28-Nov-2025 14:21:06.675)
Breaking News! Bears Momentum Alert (28-Nov-2025 14:21:06.590)
[XNSA]>> OFF MARKET TRADE
[XNSA]>> IMPERIAL ASSET MANAGERS LIMITED - APPOINTMENT OF DIRECTORS
[XNSA]>> OFF MARKET TRADE
[XNSA]>> DAILY FUND PRICE SUBMISSION - FCMB ASSET MANAGEMENT LIMITED
[XNSA]>> NORRENBERGER MUTUAL FUNDS WEEKLY UPDATE
[XNSA]>> VFD GROUP PLC: EXTENSION FOR TRADING IN RIGHTS ISSUE
Get IDIA - the stock trading app for the modern investor
Solutions by Business
Product Suites
Company
Contacts
- 8th Floor,
- South Atlantic Petroleum Towers,
- 1 Adeola Odeku Street,
- Victoria Island,
- Lagos, Nigeria.
- Email: solutions@infowarelimited.com
Follow Us
 |
 |
 |
 |